Solve supply chain challenges
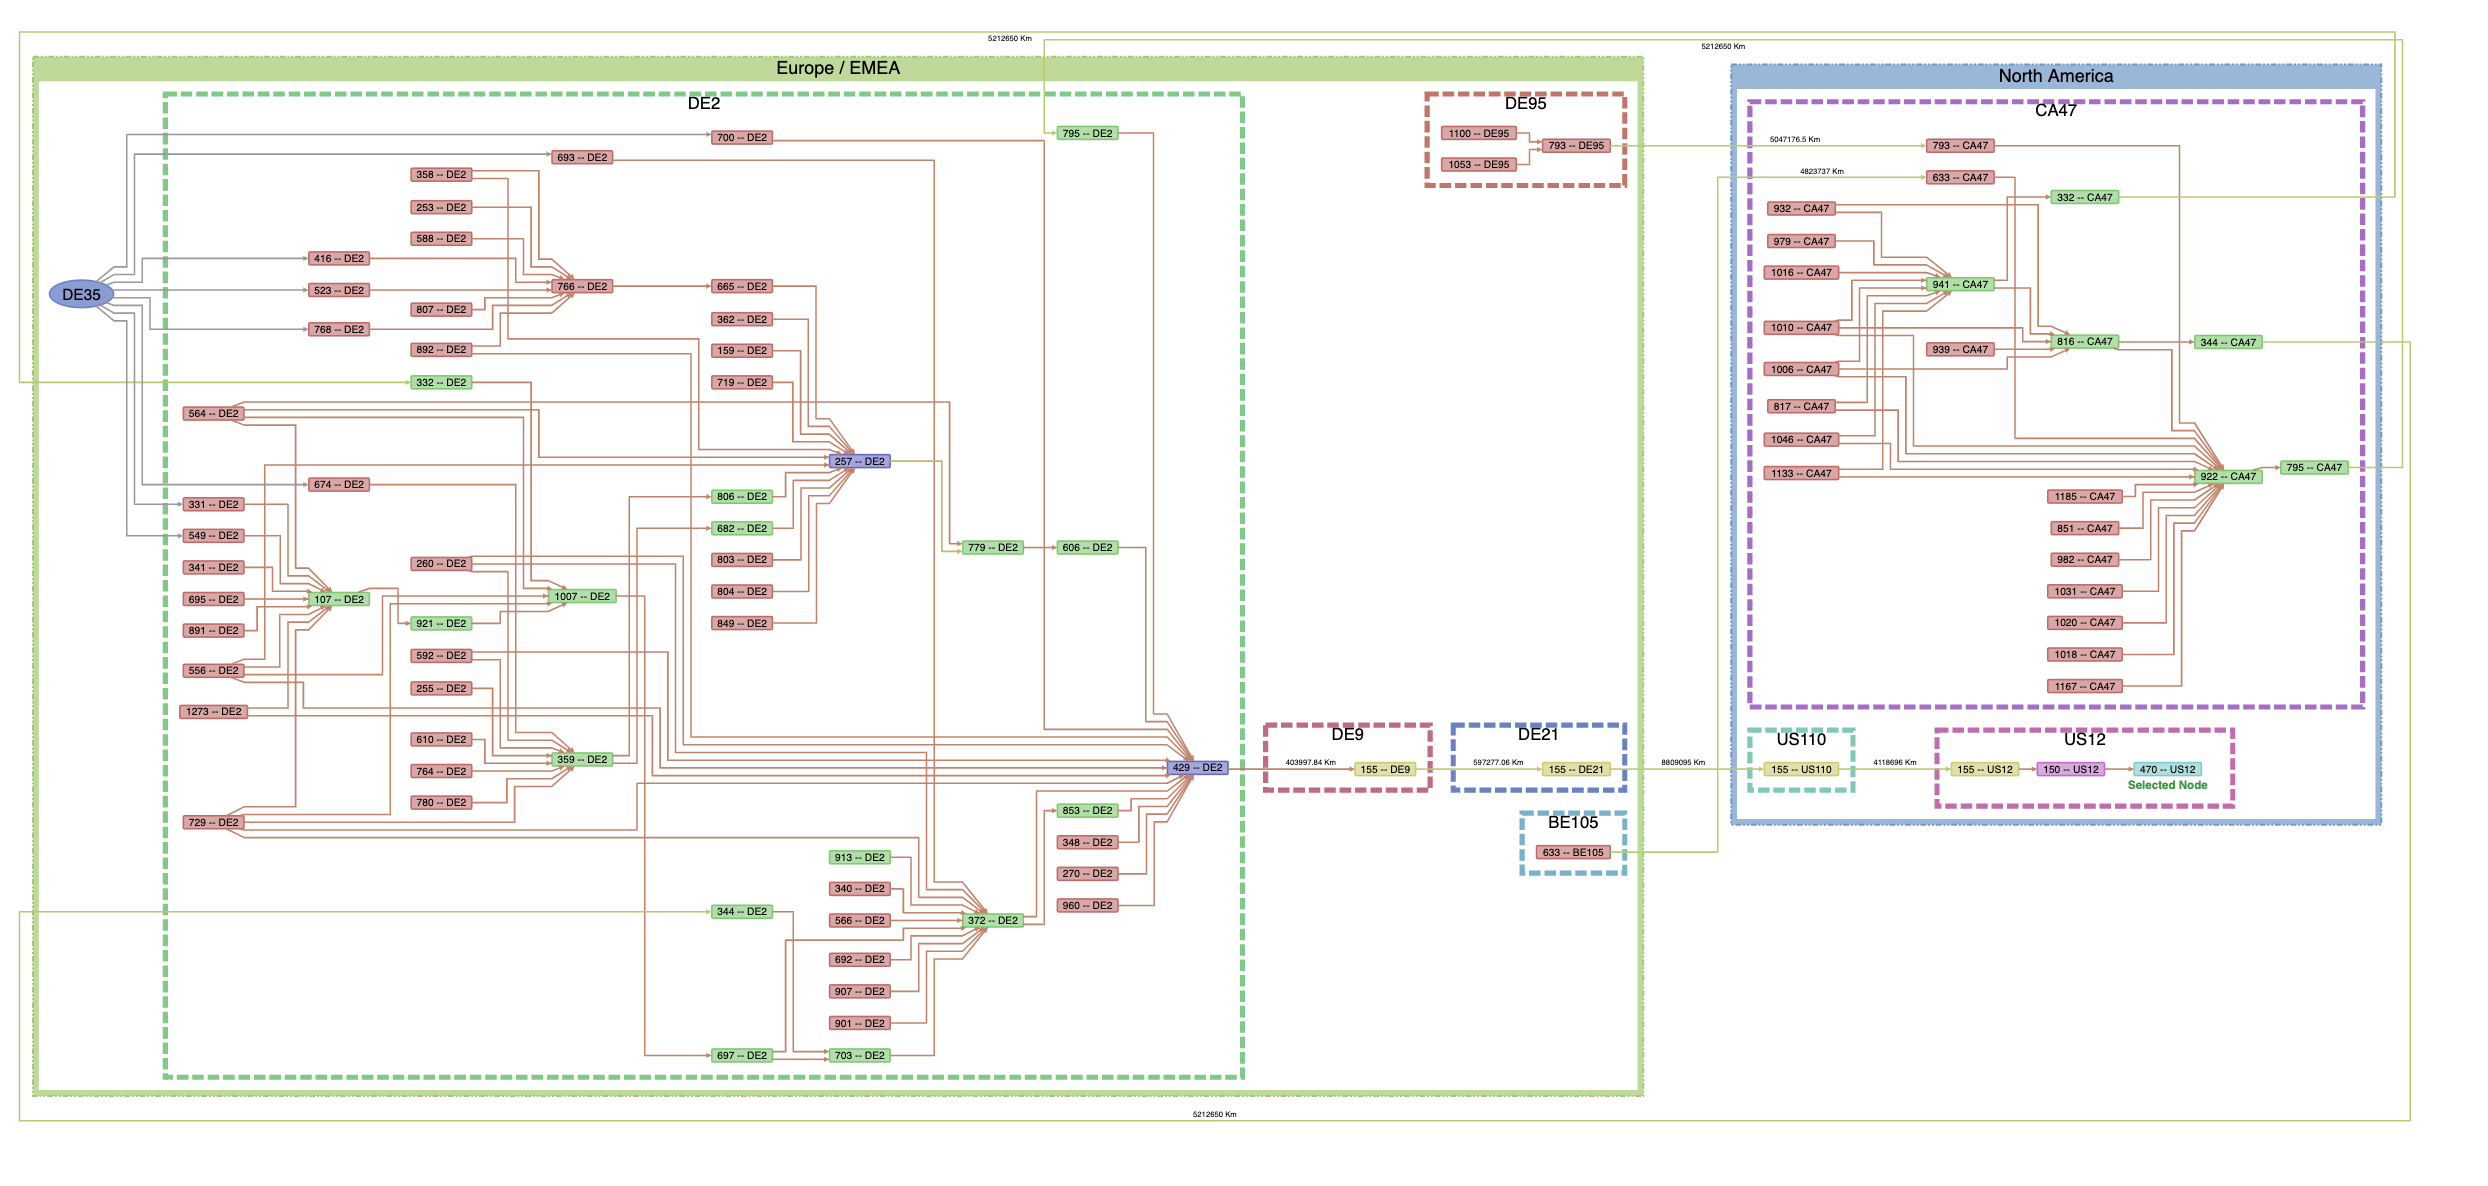
Supply chains must work smoothly to achieve a high quality product, on time and on budget. One touchpoint in the sub-process may have an unanticipated impact on a host of other dependent processes. Material dependencies in your supply chain must be clearly explained—from raw ingredients to the final product.
Perspectives can illustrate the related logistics by visualizing how global production might be impacted by localized issues so you can mitigate risk. Using scene-based user interfaces, you can abstract your data and see both high level and low level details. Timelines can show how things change over time. Maps show you where things are happening.
Save time and money
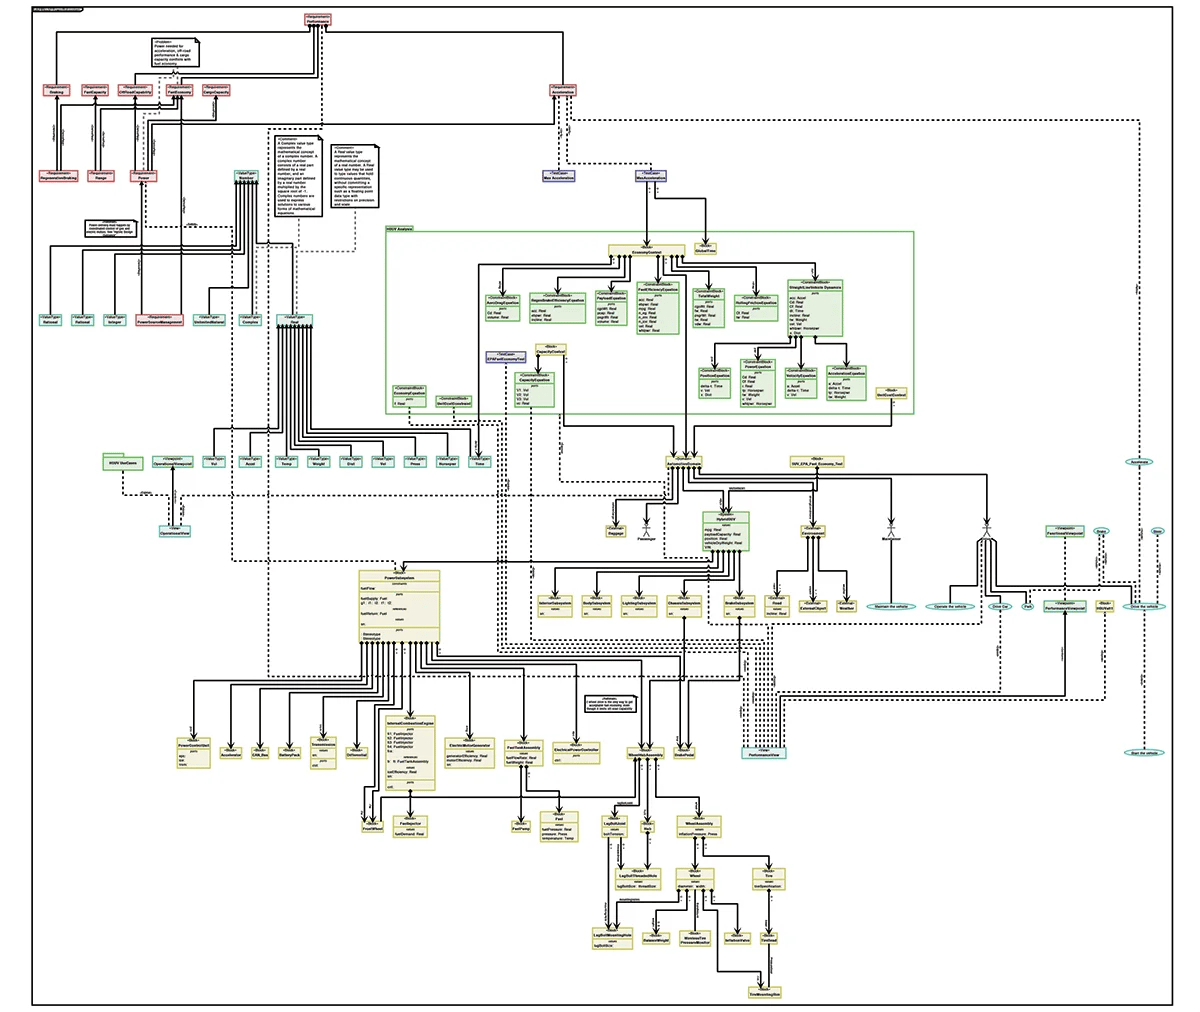
Our Model-Based Engineering expertise knows no bounds! Use Perspectives or our end-user Model-Based Engineering application to quickly generate diagrams for your Block Definition, Internal Block, and Parametric Diagrams. Focus your time and effort on modeling and analysis. Easily and automatically enforce SysML drawing conventions for consistent, readable, and dynamic diagrams using built-in layout algorithms.
Understand manufacturing processes
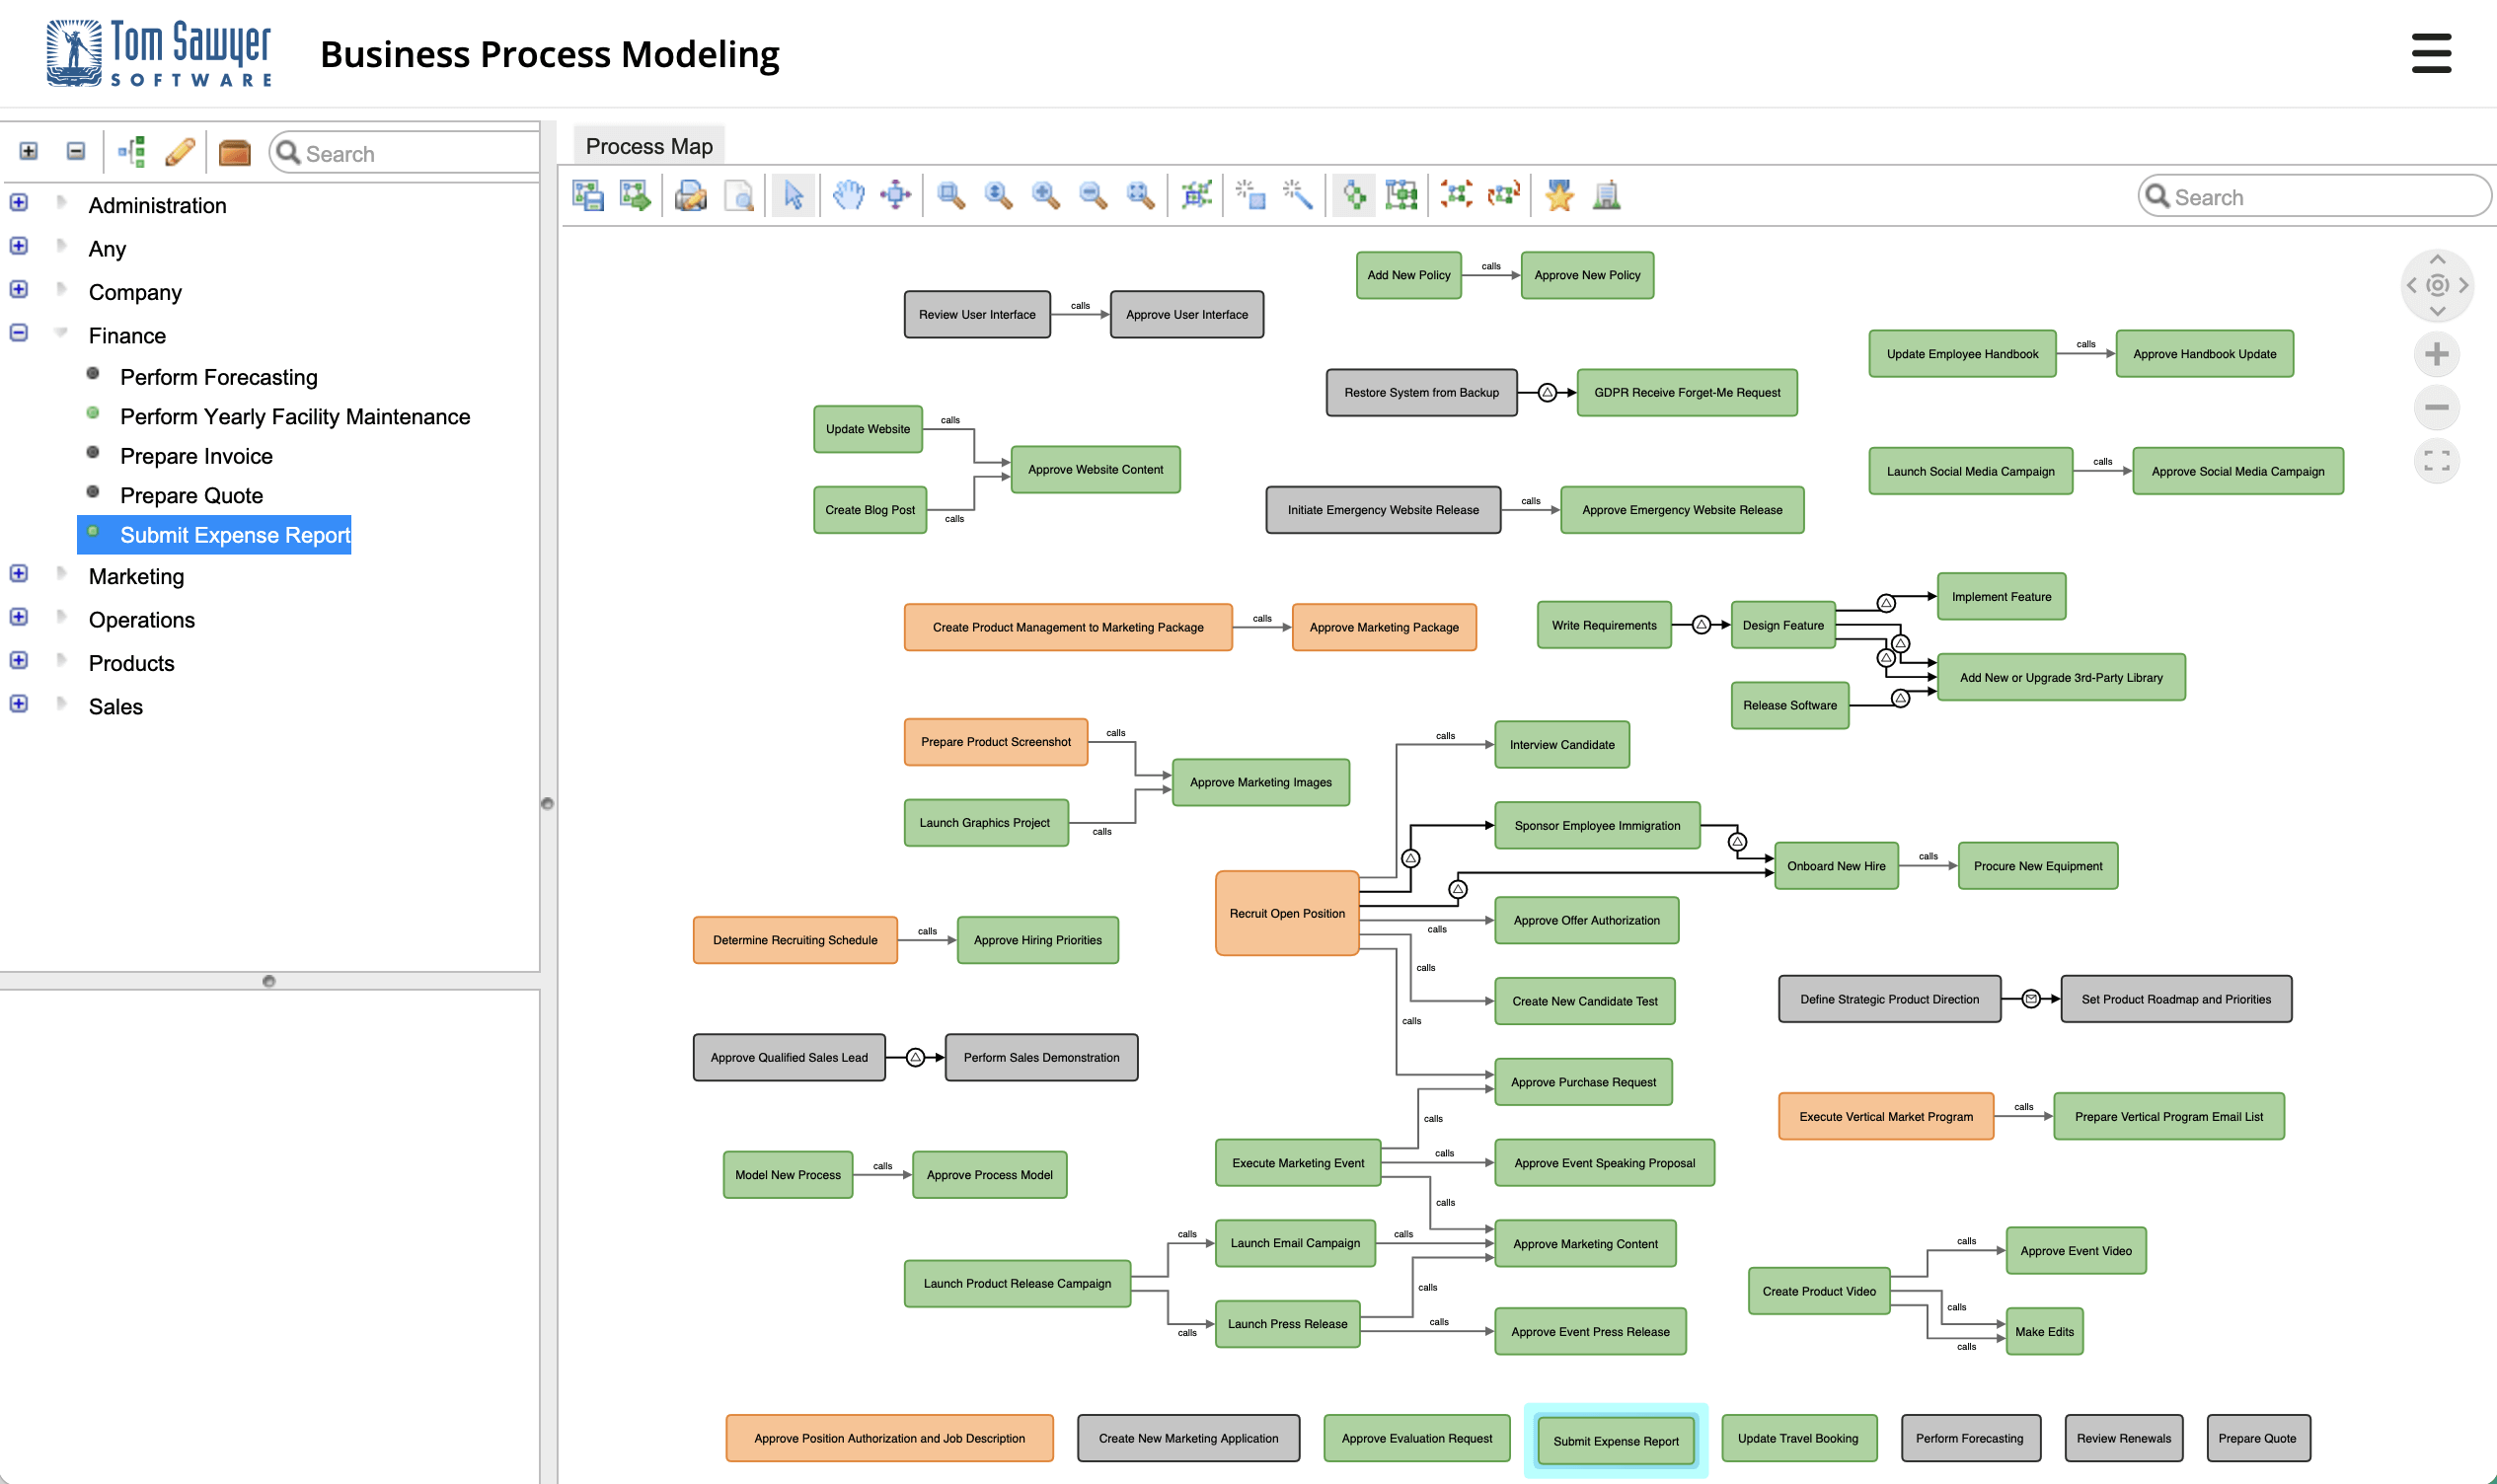
Don't forget the human element! Are business decisions being made by the right people at the right point? Can the impact of those decisions be understood and measured as they flow downstream? Applying graph visualization and analysis to the organization level of your business can be a powerful tool for operational success.
Using Business Process, you can see a bird's-eye view of your processes and their relationships. Visualizing processes and people clarifies responsibilities and highlights bottlenecks, so your organization runs smoothly and efficiently.