Graph Technologies

Advance your digital transformation initiatives with the power of graphs

Pioneers in graph technology

Tom Sawyer Software was the first pure graph technology company. We understood early on how the power of graph could be applied to solve business challenges.

Our graph technology has been honed over decades and vetted by industry leaders. When you work with us, you know you'll receive best in class software and support from a graph technology veteran.

Crime Network

Perspectives 13.0 Beta Now Available

Download the beta today for a sneak peek of what's to come in 13.0:
 
  • New React-based web client rendering framework for a modern look-and-feel

  • Enhanced Query Builder to search for graph patterns through an intuitive graph visualization

  • Updated RDF integrator now supports CRUD operations for increased efficiency and flexibility

Why work with Tom Sawyer Software?

30-year Track Record

30-year track record

We have a long history of developing cutting-edge graph technology solutions and partnering with enterprises and integrators to build game-changing experiences with data.
Practical Experience

Practical experience

We have practical experience solving problems for almost every size and type of organization, in almost every industry. Our graph experts have seen hundreds of different use cases and apply their combined decades of experience to your unique challenges.
Deep Technical Knowledge

Deep technical knowledge

We have built a reputation as having a keen understanding of and hands-on experience with cutting-edge technologies.

Unrivaled Graph Drawing

Unrivaled graph drawing

No other software produces clean, readable graphs like our graph software does. We offer five graph layout styles, each suited to different use cases.
PreBuilt And Custom Solutions

Pre-built and custom solutions

One size doesn't fit all. When one of our pre-built, off-the-shelf solutions isn't enough, our graph application development platform provides the flexibility you need to create a custom solution.

Exceptional Technical Support

Exceptional technical support

Our team of graph gurus can do it all: solve a technical challenge, provide advice for graph best practices, build a custom graph application for you, or integrate graph technology into your existing solution.

We transform your data into actionable visualizations

Our graph technology solutions transform your data into beautiful, accurate, and readable graph and data visualizations. 

In a matter of minutes, federate and integrate data from almost any data source and format, and create a beautiful dashboard of visualizations. 

Drag the slider below to see the before and after.


Watch these videos to learn how easy it is to connect to a data source and create visualizations with Perspectives, our graph platform.

The best companies in the world agree: We're the best!

We work with all types and sizes of companies, from startups to Fortune 1,000 companies, that span many different industries including Finance, IT, Manufacturing, Aerospace, and Automotive. Our flexible graph solutions are used by software developers, database architects, systems engineers, data scientists, and more.

We are proud to work alongside the best and brightest in their respective fields.


Logos of our customers

What customers are saying

TIBCO

[Tom Sawyer Software] makes our product easier to demonstrate, and shows the larger picture to customers.

TIBCO

Hursley Hub

We have partnered with Tom Sawyer Software and received excellent service that has complemented its outstanding visualization platform.

Hursley Limited

Procter & Gamble

Tom Sawyer Software always falls in love with the business problem before employing its deep problem solving skills and unparalleled mastery of the data/knowledge visualization and graph analysis domains. The result is innovative yet practical solutions that consistently exceed expectations. 

Procter & Gamble

7Q7P

I was literally drawing graphs like these on whiteboards without knowing what they were. When I found Tom Sawyer Software, I thought: "Here's the solution to my problem!"

7Q7P

Use cases solved by our solutions

We have applied our graph expertise to 100s of different use cases and technology stacks, helping enterprises tackle their big data challenges. No matter your unique application requirements or data source, there's a good chance we have encountered it.

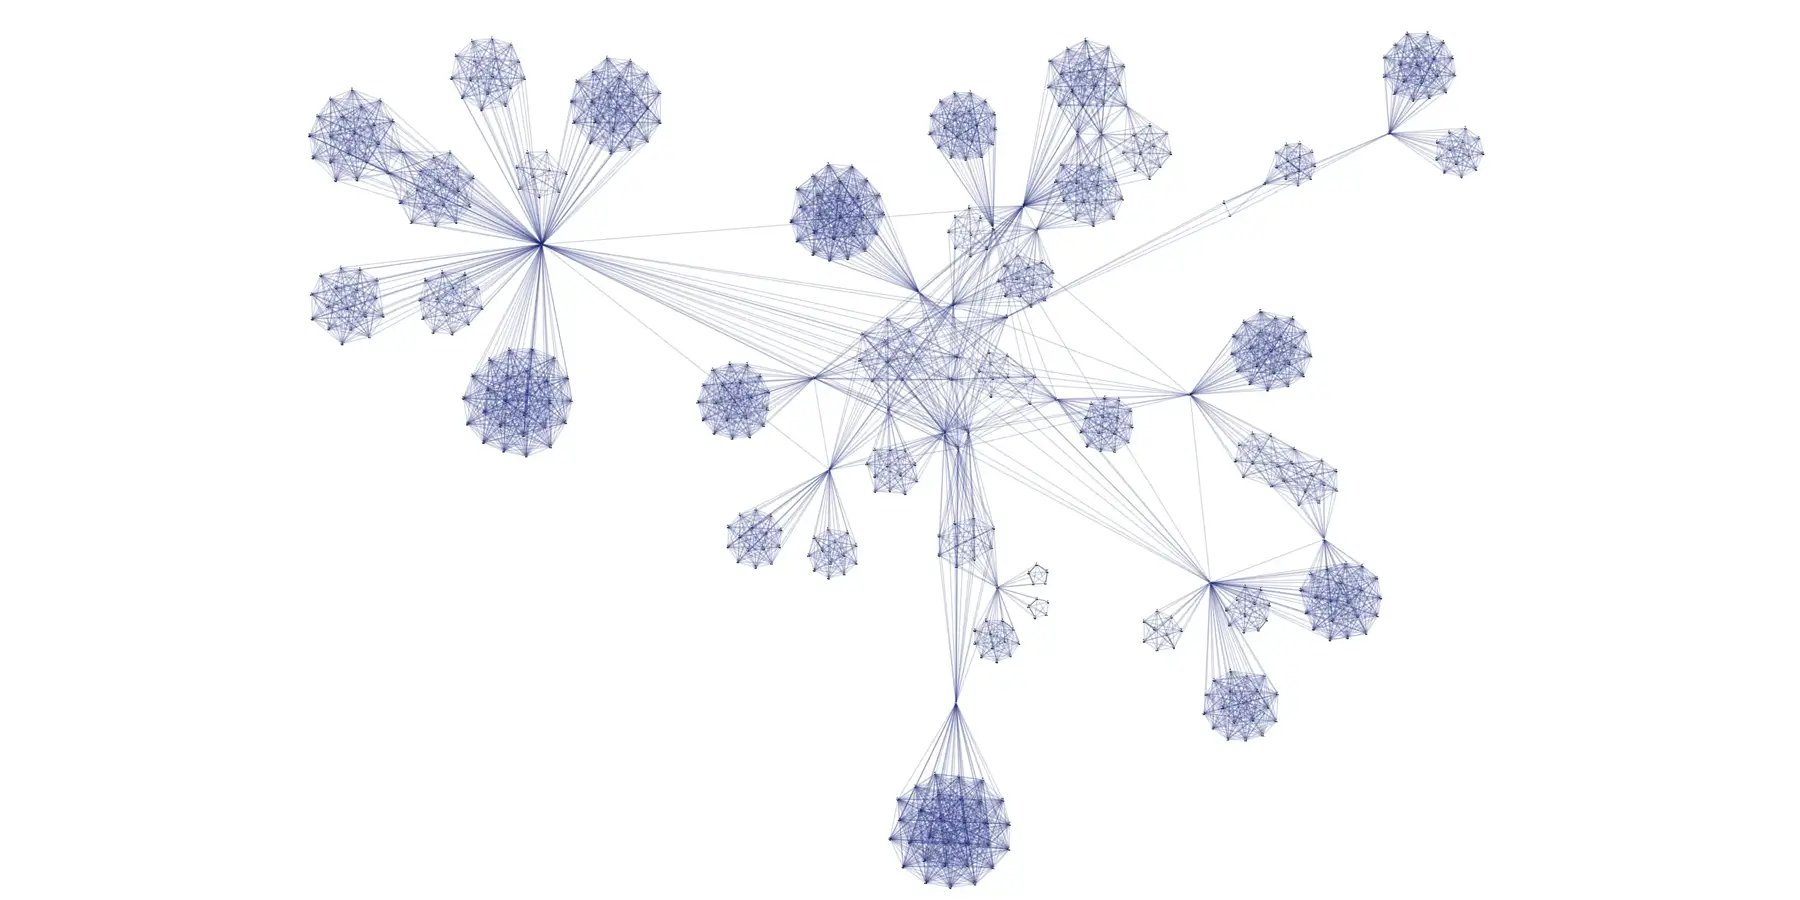
Our unparalleled graph drawing capabilities set us apart from our competitors who provide simple, spring embedder-type layouts. Our five advanced graph layout algorithms have been perfected over the decades and allow us to handle your most challenging requirements, whether that's for detailed electrical schematics, knowledge graphs, location-based visualizations, deeply nested data, and much more.

We have also developed a suite of graph analysis algorithms allowing you to apply advanced graph analytics to gain additional insight into your data.

And our graph technology platform has been perfected with regular releases over the past 15 years.  

Here are just a few examples of some of the use cases our graph experts and solutions have helped address.

Airplane Physical and Logical Electrical System Diagram

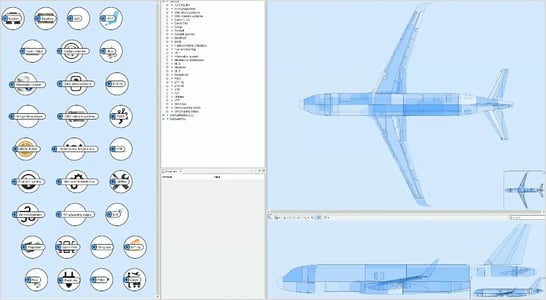
Mechanical and system design

Systems engineers rely on precise schematics when designing complex machinery such as airplanes. Our precision graph drawings excel in this area. We partnered with a top manufacturer to develop a touchscreen application that showed the physical and logical connections of an airplane's electrical system, providing context to technical and non-technical users alike with our powerful visualizations and ability to navigate the electrical system.
Supply Chain With Chart

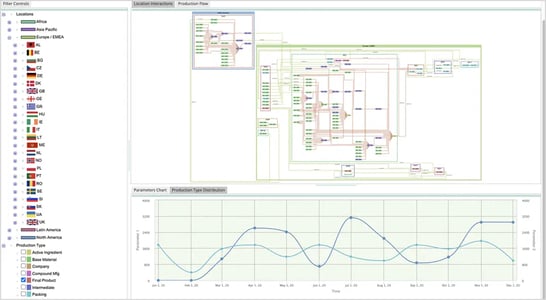
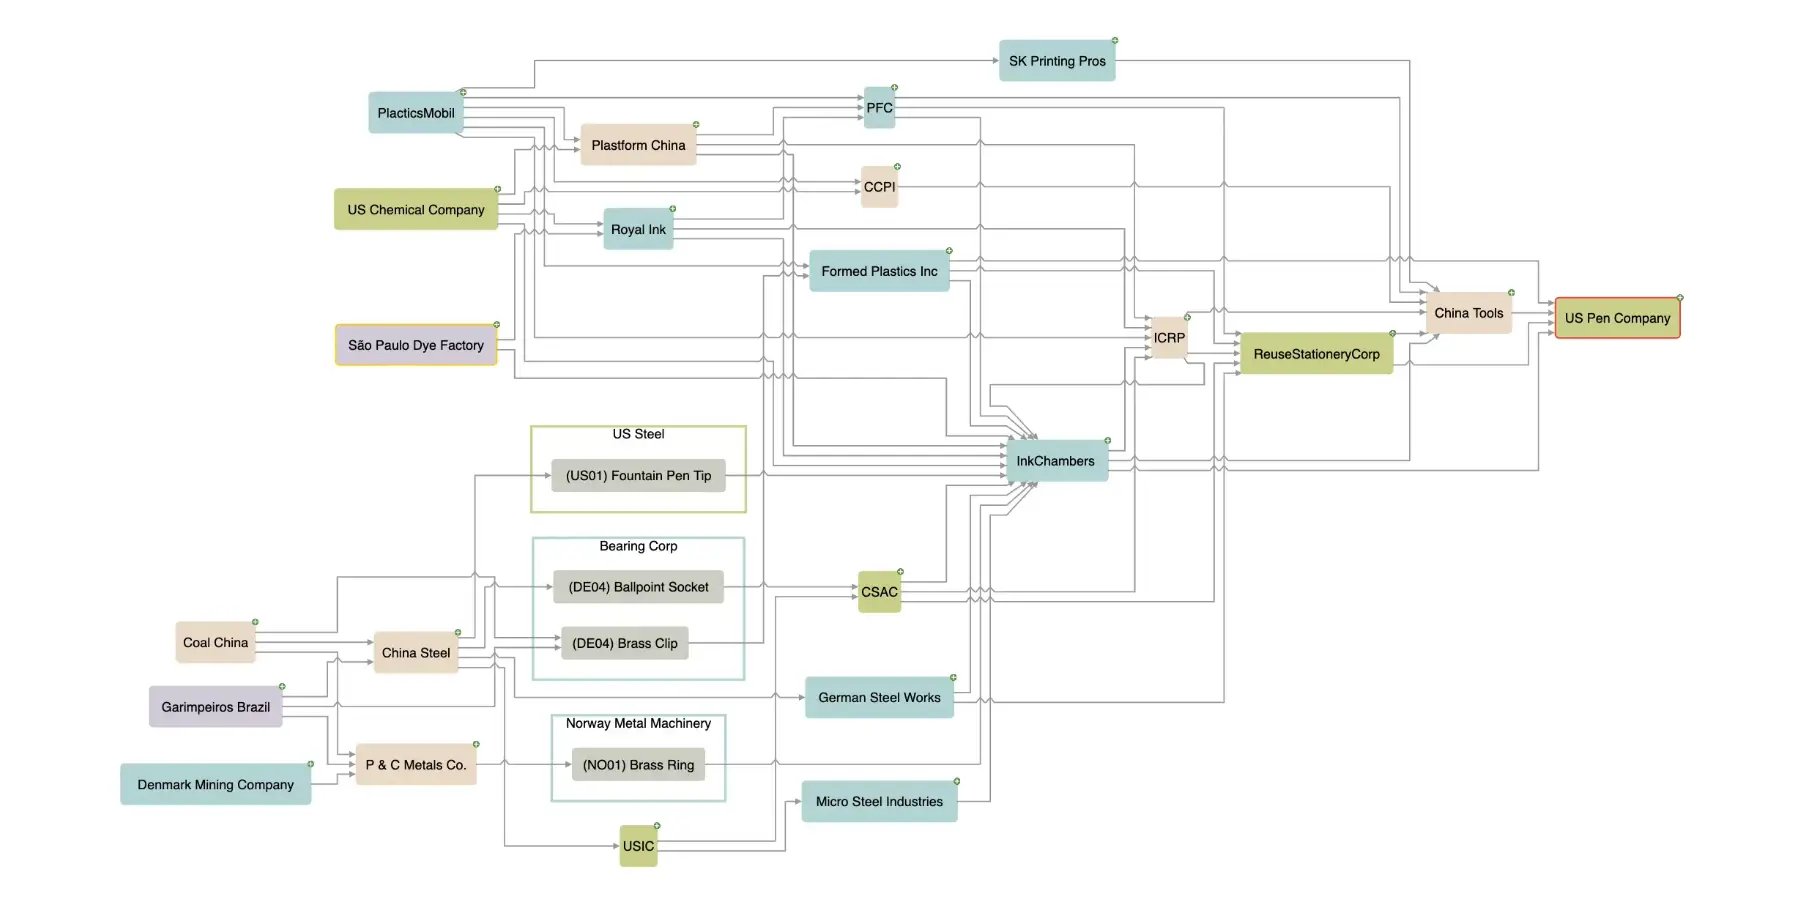
Supply chain analysis

In today's global business environment, supply chains quickly become complex as you source materials from different partners around the world. Add in weather, pandemics, staffing, and other issues, it can be a challenge to maintain inventory and keep up with demand. We built this example application to showcase our capabilities. The application presents a real-world supply chain that you can navigate and identifies problematic chains. Sign Up and test drive it for yourself to see the possibilities.
Enterprise Knowledge Graph

Enterprise knowledge graphs
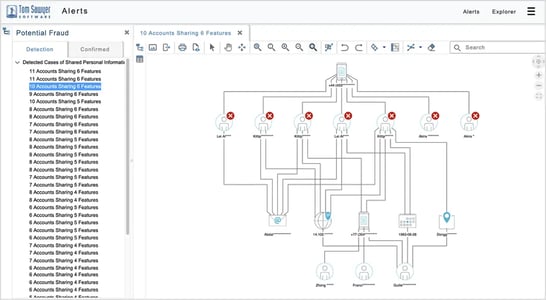
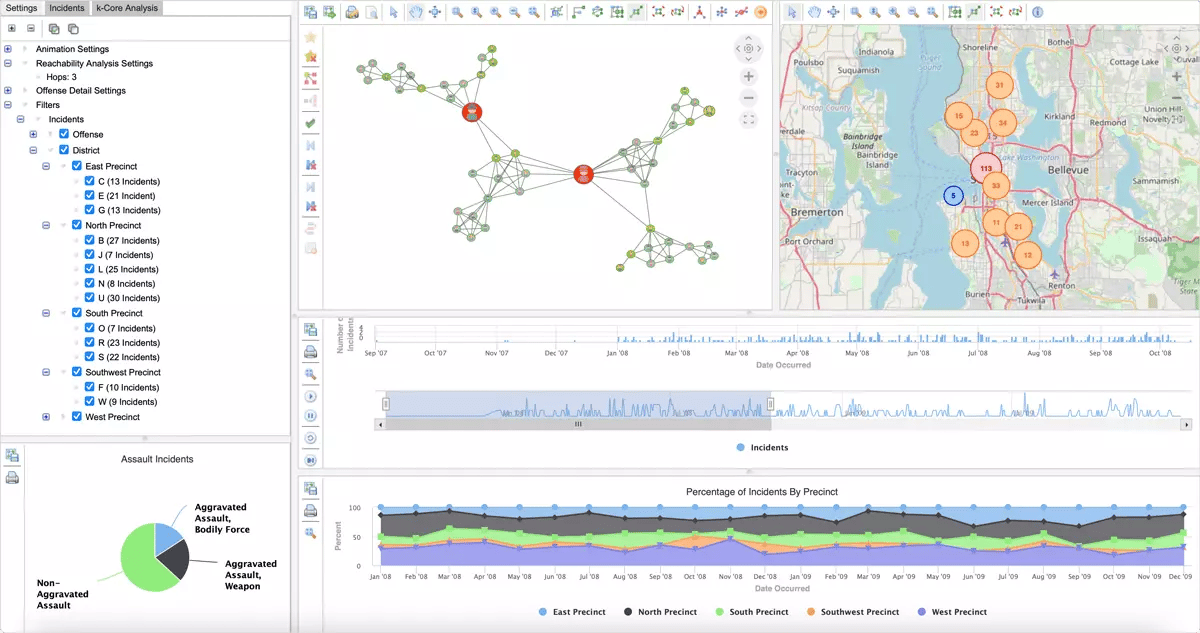
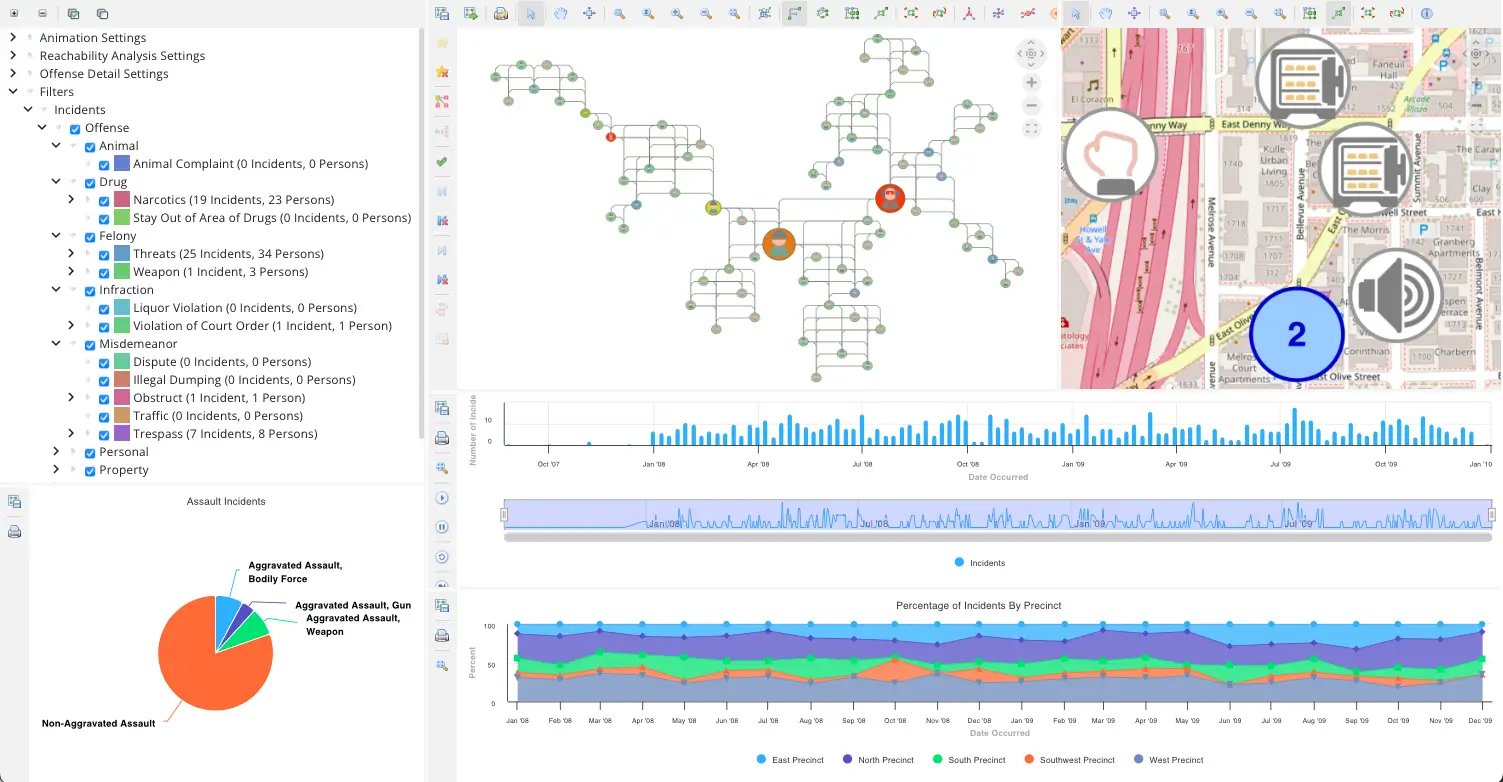
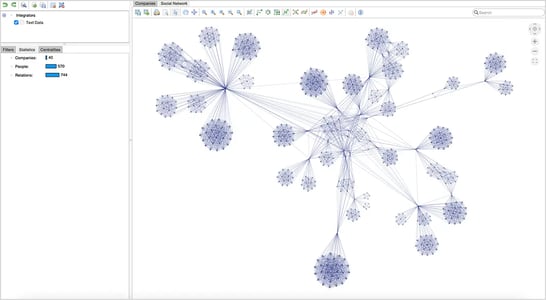
As data becomes larger and more complex, organizations can discover insights in their knowledge graph with Perspectives. The data integration layer can effectively and efficiently load structured graph data into a native graph, in-memory graph model while advanced graph visualization and analysis provide ways to find and understand the pertinent information in the knowledge graph. Learn more.
Graph of Fraud Alerts in Financial Transactions

Link analysis

Link analysis applies to financial fraud, policing, military and defense applications, and more. Link analysis is a technique to evaluate relationships between nodes. When combined with other types of analyses, such as betweenness and degree centrality, these graph techniques are powerful tools to identify fraud before it happens.
IT and Network Management Dashboard of Graphs and Charts

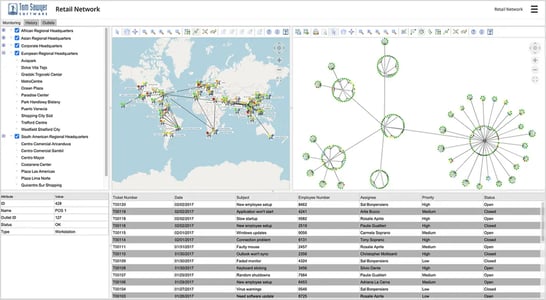
IT and network management

IT and network managers need fast, reliable ways to manage their networks. Since these networks can be modeled well with graphs, Perspectives visualizations, analysis, and synchronized views can help managers to better understand and optimize networks.
Graph of Multi-Step Business Process

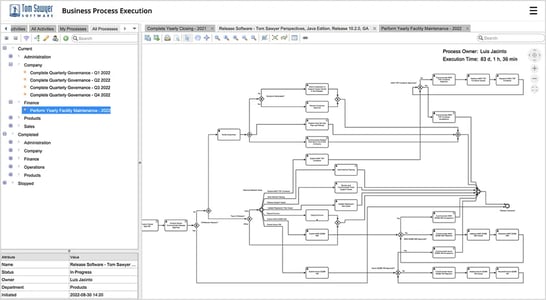
Business process modeling

Process is key to keeping an organization running efficiently. Our advanced graph visualization technology keeps process modelers focused on designing processes instead of rearranging boxes. No matter how complex the process, tasks are automatically laid out in a readable graph that everyone can follow. Learn More.

Start your graph journey today

Contact us to discuss your use case.

Design a custom application with Perspectives, the low-code, scalable graph platform

Tom Sawyer Perspectives is a low-code, data-oriented graph visualization and analysis development platform. Integrated design and preview interfaces and extensive API libraries allow designers and developers to quickly create custom applications that intuitively solve big data problems.

Use features like nested drawings, advanced node and edge labeling, precise shape clipping, port and connectors controls, and incremental layout to see the superstructure of your data and produce visually clear graphs that are understood by domain experts and stakeholders alike.


Graph visualization applications for everyone

Perspectives has been used by everyone from two-person startups to the Fortune 500 and major universities.
For Your Team

For Your Team

IT and Data Science teams develop the applications and assets that make an organization hum. Perspectives can help make the most of your connected data. Build Perspectives applications and deploy them to your organization's cloud environment to serve internal users.
For Your Customers

For Your Customers

Perspectives powers visualization applications for network monitoring, law enforcement, finance, organization management, model-based engineering, and more. OEM Perspectives and integrate powerful and precise visualizations into your commercial products.
For Academic Research

For Academic Research

Students and professors who work with networks, systems models, life sciences models, or other relationship data, can use Perspectives to uncover hidden connections in the data to advance their research. We offer academic users a free, 1-year license for non-commercial usage.

End-user applications built for a purpose

When building a custom application is not your area of expertise, we offer the following out-of-the-box solutions for some common use cases.

Model-Based Engineering


Model-Based Engineering


Transform your model definitions into rigorous, customized, user-friendly, and highly interactive visualizations.


Graph Database Browser


Graph Database Browser


Connect to your favorite graph database to instantly visualize, analyze, and interact with your data.


Business Process


Business Process


Visually model your business processes and then flawlessly and repeatedly execute them.


Read the latest blog posts

Big Data Graph Analysis: Revolutionizing Data Insights

Big Data Graph Analysis: Revolutionizing Data Insights

By MAX CHAGOYA
Neo4j Knowledge Graph: Transforming Data Connectivity and Intelligence

Neo4j Knowledge Graph: Transforming Data Connectivity and Intelligence

By THANOS GIANNAKIS
The Power of Knowledge Graph Visualization Tools

The Power of Knowledge Graph Visualization Tools

By LIANA KIFF

Get Started

Contact us to talk about your data project and discover how Tom Sawyer Software graph solutions can lead to the answers you need.