What is graph analysis?
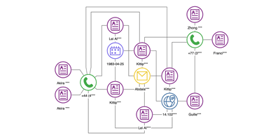
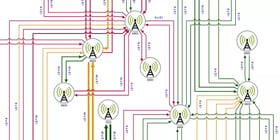
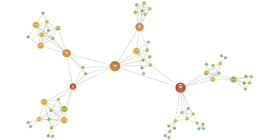
Connected data and graphs are everywhere—in social and computer networks, steps in a process, supply chains, and more. A graph is a set of nodes and edges that connect the nodes to each other. Nodes can represent any object, task, or state while the edges represent the relationships and dependencies between them.
Graph analysis is the application of data-driven techniques for the discovery of actionable information, which can be hidden in connected data.
Graph analysis can help you:
- Discover areas of interest in data
- Optimize complex systems or processes
- Deliver key information to stakeholders and decision makers in a timely manner
Graph analysis algorithms can be run in real-time, through automated background processes, or interactively by users.
Whatever your goals are with data, using graph analysis to understand which nodes or edges are more important than others is key for gaining value and intelligence from data.
Common types of graph analysis techniques.
Why graph analysis matters
Graph analysis helps you find what is important in data—to get past the noise to enable data-driven knowledge.
The application of graph analysis techniques enables enterprises to:
- Analyze complex systems models
- Find key people in social networks
- Optimize throughput of manufacturing systems
- Find important patterns
- Understand system dependencies and flow
- Discover vulnerabilities
- Analyze critical paths
- Determine root cause
- Perform post-event analysis
- Analyze future scenarios
- Apply what-if analysis
- See the superstructure of systems for subgraph summarization
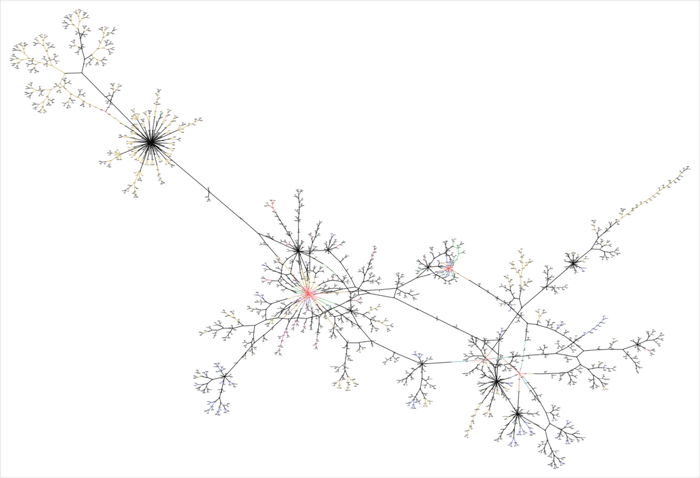
Combining graph analysis with visualization supports finding additional insights and facilitates effective communication to stakeholders and decision makers.
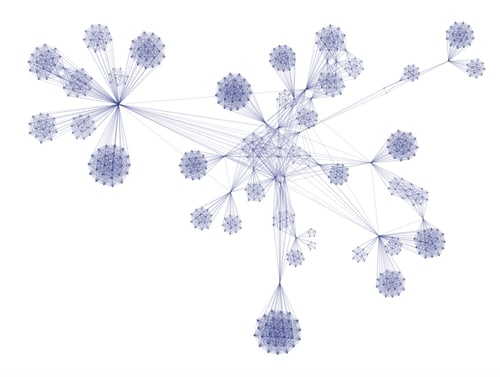
Graph analysis is key in analyzing social networks.
Who needs graph analysis?
Graph analysis is applicable to industries in the private and public sectors. Data analysts and data scientists rely on graph analytics to solve big data problems in digital transformation, digital engineering, supply chain, logistics, social network analysis, and fraud detection and prevention.
Graph analysis is impactful in many industries where having up-to-the-minute information is crucial and decisions have major consequences:
- Manufacturing
- Law Enforcement
- IT
- Banking
- Insurance
- Government

“Graphs form the foundation of many modern data and analytics capabilities to find relationships between people, places, things, events and locations across diverse data assets. D&A leaders rely on graphs to quickly answer complex business questions which require contextual awareness and an understanding of the nature of connections and strengths across multiple entities.
"Gartner predicts that by 2025, graph technologies will be used in 80% of data and analytics innovations, up from 10% in 2021, facilitating rapid decision making across the organization.”
—From “Gartner Identifies Top 10 Data and Analytics Technology Trends”
Graphics Specialized for Your Graph Data Application
Perspectives is optimized with high-speed graphics capabilities and HTML5 canvas graphics to create the best in class graph visualizations for your application. You can use Perspectives HTML classes embed the visualization components into your web application and when the HTML class is assigned to any HTML tag, such as <span> or <div>, the tag will be interpreted as a component, regardless of its type.
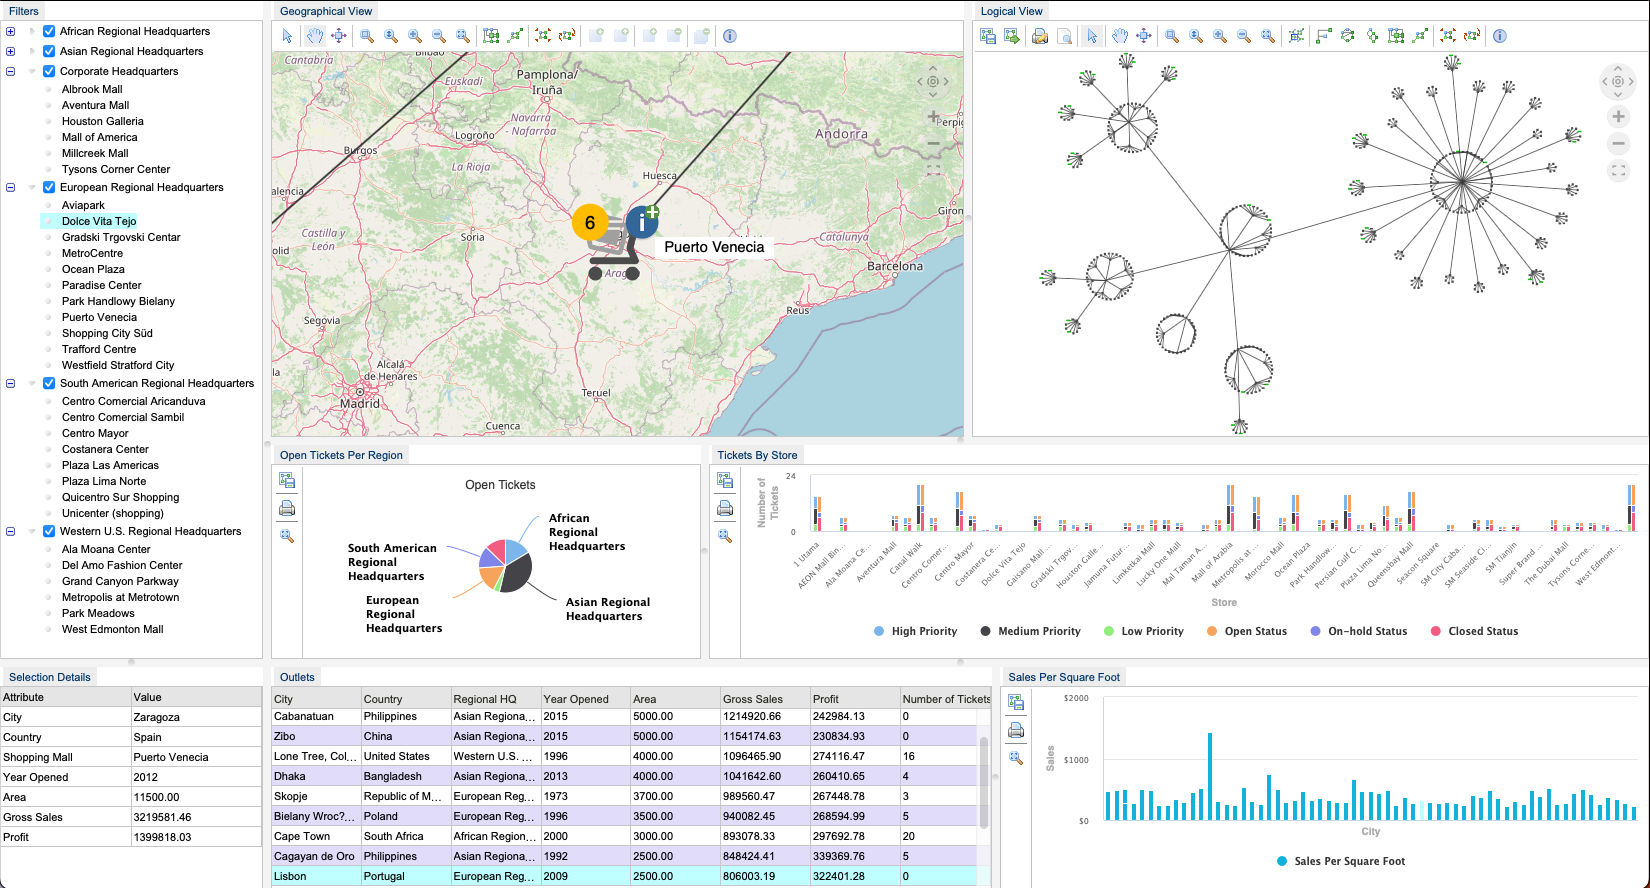
Tom Sawyer Perspectives, the ultimate graph analytics software
Tom Sawyer Software is an industry expert when it comes to working with connected data. Our graph experts have decades of experience working with enterprises on their most challenging data problems.
Our graph platform, Perspectives, addresses big data challenges from two important angles—combining powerful graph analytics tools with revolutionary graph visualization.
Learn how graph analysis and graph visualization techniques reduce the noise in your data:
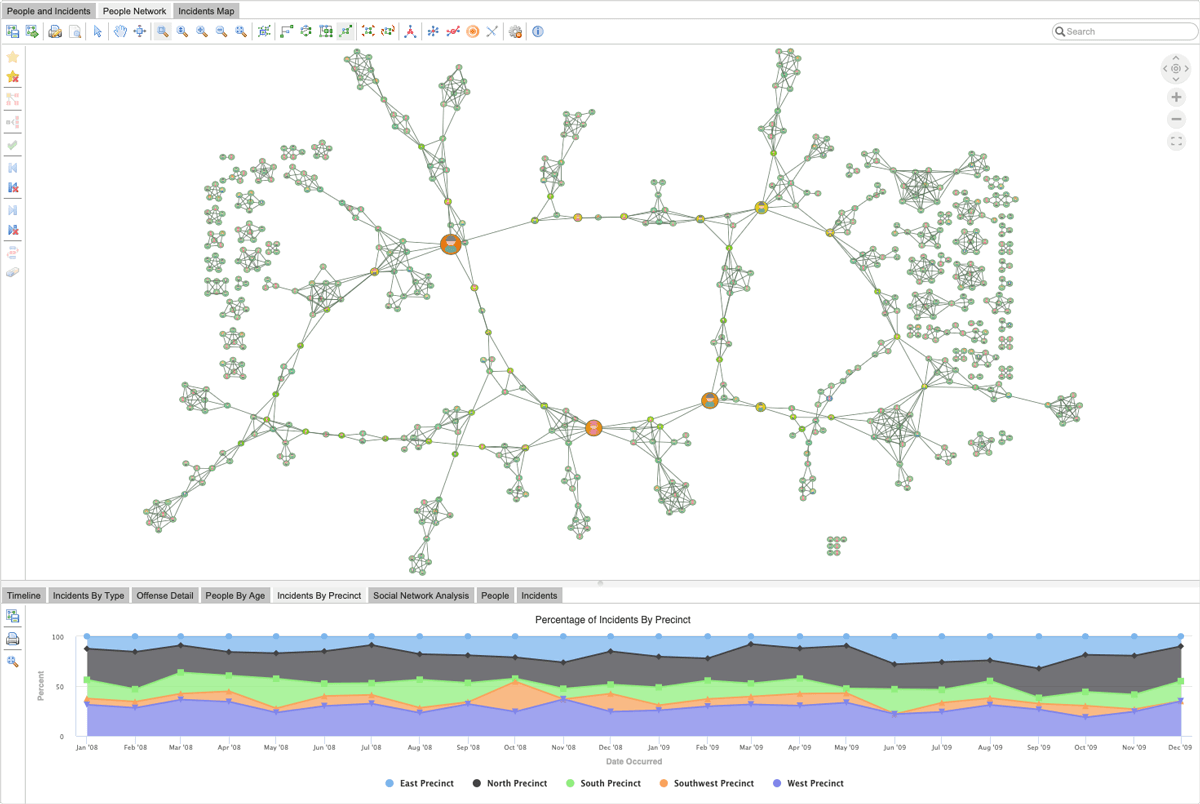
An example crime network application built with Perspectives.
Perspectives puts powerful graph analysis tools at your fingertips
Perspectives is a low-code application development platform that enables developers to build custom graph visualization and analysis applications to meet their unique use cases.
Perspectives includes a suite of integrated graph analysis algorithms that are a powerful arsenal for data analysis. You can apply analysis to your graph or subgraph of choice without the need to write any code.
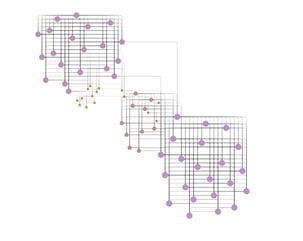
A hierarchy of key graph elements.
Traversal Analysis Algorithms
Traversal algorithms enable you to understand how best to visit all the nodes of your graph in an effective order. These techniques can be used in systems modeling and verification applications or as part of an additional analysis technique.
Traversal algorithms included with Perspectives:
- Breadth First Search
- Depth First Search
- Topological Sort
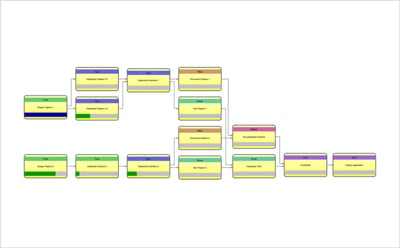
Clustering Analysis Algorithms
Clustering algorithms identify areas with higher connectivity by finding different types of natural clusters—or groups—in the topology of a graph. These algorithms are useful for operations and enterprise architecture management.
Clustering algorithms included with Perspectives:
- Clustering
- k-Core
- m-Slice
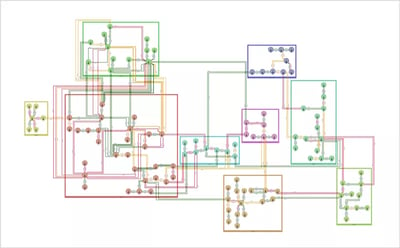
Partitioning Analysis Algorithms
Partitioning algorithms determine how to best divide a graph into pieces to help you discover natural groupings in your data. These algorithms can be used in preparation for the other graph analysis techniques which can be applied to the different pieces of the graph. They can also be used to find vulnerabilities in systems models or computer networks.
Partitioning algorithms included with Perspectives:
- Connected Components
- Biconnected Components
- Strongly Connected Components
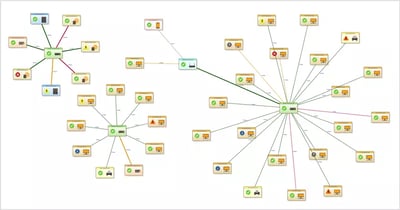
Path Analysis Algorithms
Path finding algorithms help you discover important paths within a graph to show the most efficient or most important ways to get from one graph element to another. These techniques are useful for policing, finance, or life sciences investigations which need to determine how graph elements are related.
Path algorithms included with Perspectives:
- All Pairs Shortest Path
- Bridge Detection
- Disjoint Paths
- Path Exists
- Reachable Nodes
- Root Cause
- Shortest Paths
- Simple Paths
- Sorted Paths
- Unique Path
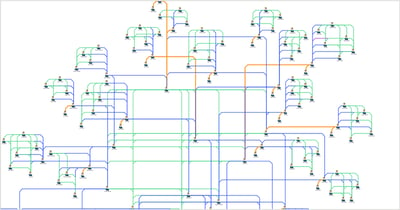
Cycle Analysis Algorithms
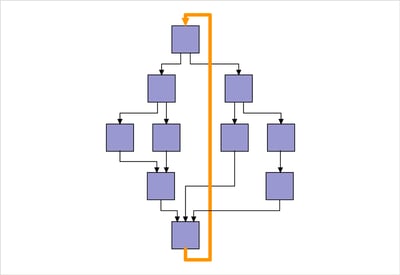
Cycle analysis algorithms find cycles and circular dependencies in graphs. Cycle algorithms can be used to find or remove circular dependencies as preparation for further graph analysis such as topological sort or maximum network flow.
Cycle algorithms included with Perspectives:
- Acyclic Test
- Cycle Breaking Edge Detection
- New Cycle Test
Social Network Analysis Algorithms
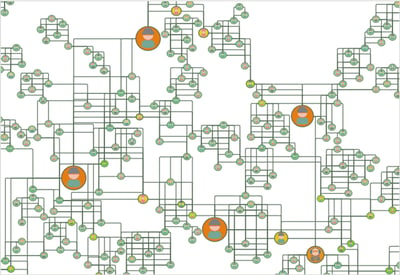
Social network analysis algorithms give each node a ranking based on an importance factor determined by each technique. These algorithms are useful for social network analysis and find important elements in the graph.
Social network analysis algorithms included with Perspectives:
- Augmented Centrality
- Betweenness Centrality
- Closeness Centrality
- Degree Centrality
- Eigenvector Centrality
- PageRank Centrality
Network Flow Algorithms
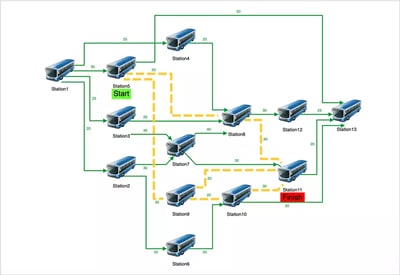
Network flow algorithms can determine flows through a system with high output or of low cost, as well as find vulnerabilities in a system. These algorithms are useful for manufacturing, logistics, and telecommunications system management.
Network flow algorithms included with Perspectives:
- Maximum Flow
- Minimum Cost Flow
- Minimum Cut
Tree Analysis Algorithms
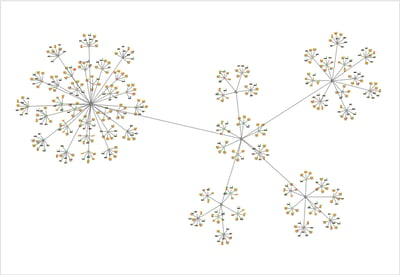
Tree analysis algorithms find the minimum set of edges that connects all of your graph elements to determine if the graph is a tree. If it doesn't have a tree, it can determine an effective tree structure within the larger graph. This tree can form the backbone of a graph and can be useful for computer and telecommunication network applications.
Tree algorithms included with Perspectives:
- Minimum Spanning Tree
- Tree Test
See graph analysis in action
Try these hands-on example analytics applications
TECHNOLOGIES
Copyright © 2026 Tom Sawyer Software. All rights reserved. | Terms of Use | Privacy Policy
Copyright © 2026 Tom Sawyer Software.
All rights reserved. | Terms of Use | Privacy Policy
