What is graph editing?
Graph editing refers to the process of modifying or manipulating graphical representations of data, typically in the form of graphs, charts, diagrams, or other visual elements. It involves making changes to various aspects of a graph to improve its accuracy, clarity, or relevance to a specific context.
Graph editing can be done using specialized software tools or data visualization platforms.
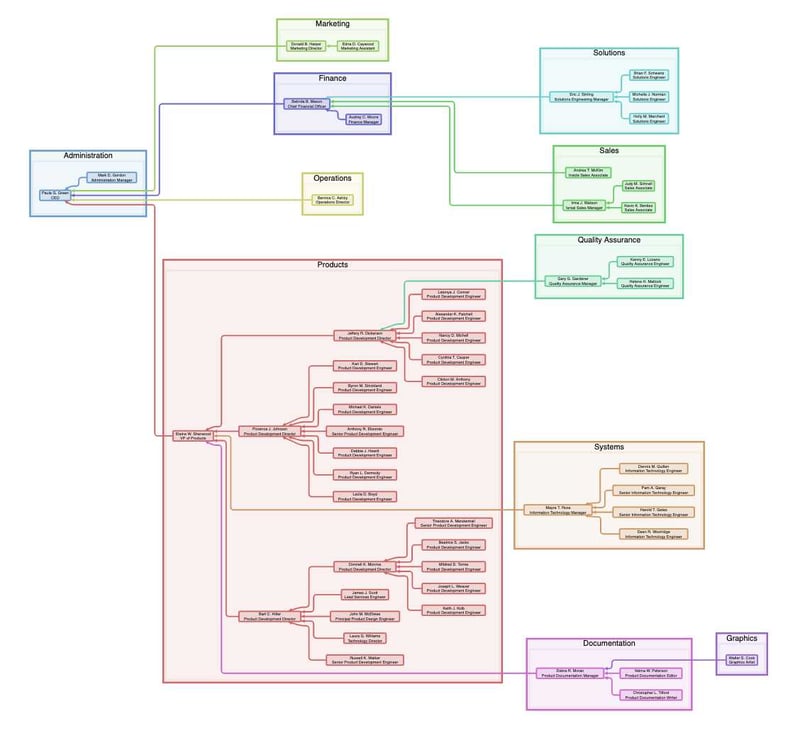
A graph visualization of a company hierarchy.

Data Accuracy
Editing a graph allows you to correct errors in the data or presentation, ensuring that the information accurately reflects the intended message. This is especially important in scientific, business, and educational contexts where data accuracy is crucial.

Real-Time Updates
In dynamic data environments, such as financial markets or live data dashboards, the ability to edit graphs in real-time allows for up-to-the-minute information presentation. This is essential for decision-making and monitoring changing trends.

Clarity and Interpretation
You can use graph editing to enhance the clarity of your data presentation. Adding, deleting, or moving elements can make it easier for viewers to understand and interpret the information.

Comparison and Analysis
Editing a graph enables you to create multiple versions of the same graph or combine different datasets for comparative analysis. This can help identify trends, correlations, and patterns that may not be apparent in the original data.

Feedback and Collaboration
In collaborative settings, being able to edit a graph facilitates feedback and revisions. Team members can suggest changes or improvements, and the graph can be easily updated to reflect these suggestions.

Storytelling
Graphs often play a crucial role in storytelling and conveying complex information. By editing a graph, you can refine the narrative and focus on specific aspects of the data to tell a more compelling and coherent story.

Error Correction
If you discover an error in a published graph, editing capabilities enable you to correct it quickly without having to recreate the entire graph. This is particularly valuable when dealing with large datasets or complex visualizations.

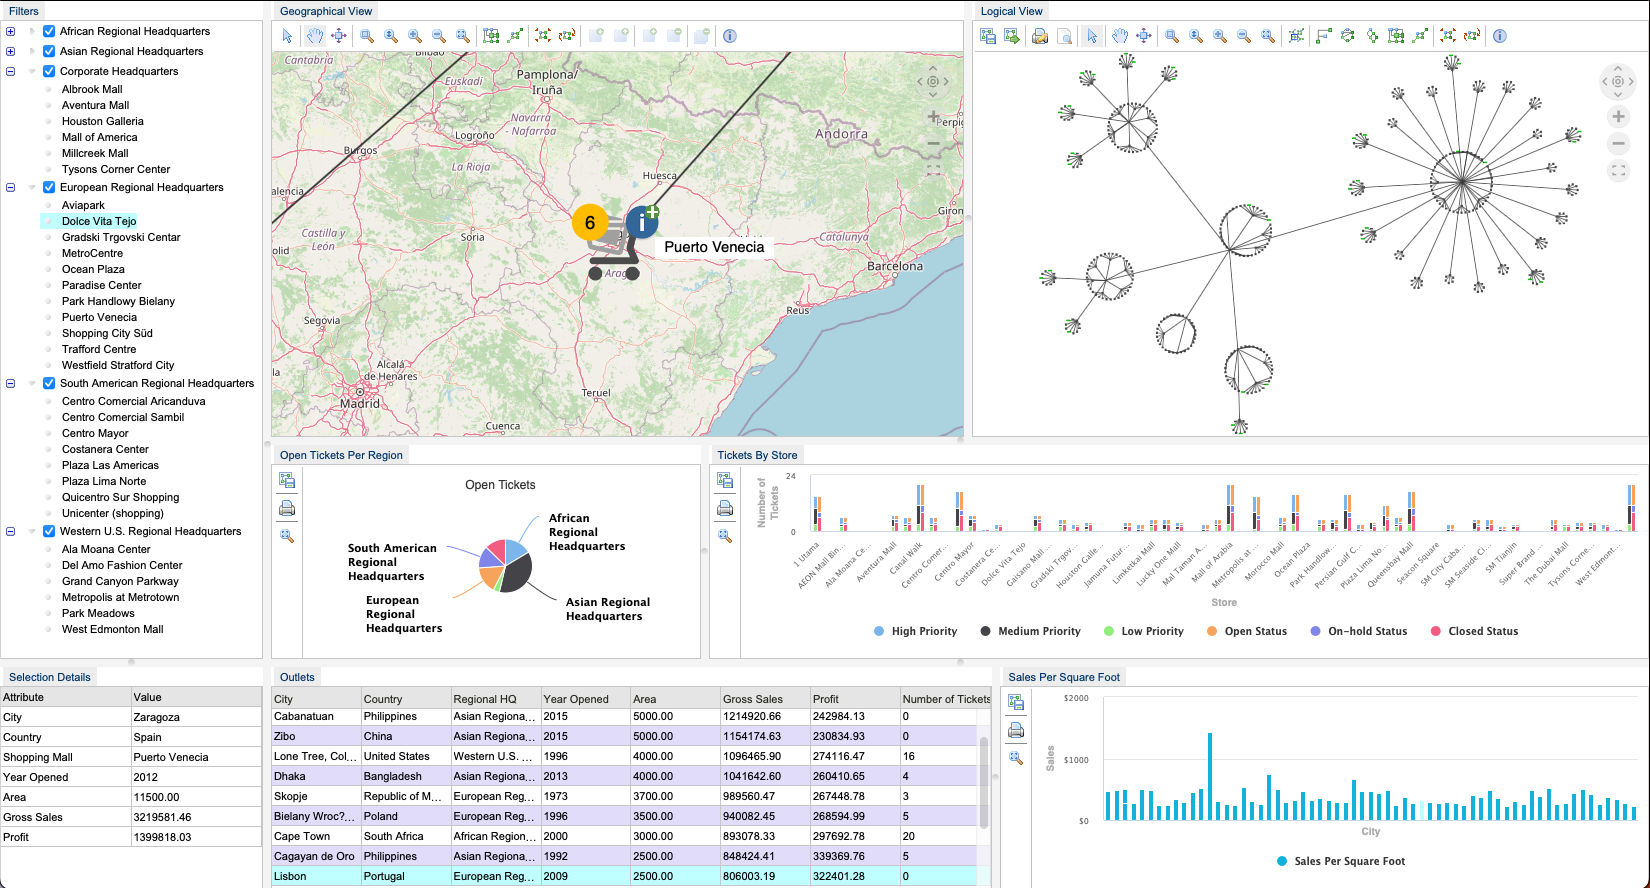
Add and update devices in an IT Network in real-time.

Identify bottlenecks and optimize your supply chain with graph editing.
Who can benefit from a graph editor?
Graph editing can benefit a wide range of industries and use cases where data visualization and graphical representations of information are valuable.
Here are just a few industries and specific use cases that can benefit from graph editing:
- Data Science Exploration: Creating and modifying graphs to explore complex data sets, such as genomic data or climate data.
- Healthcare: Editing graphs to represent patient health data, trends, and treatment outcomes for healthcare professionals.
- Supply Chain Optimization: Visualizing and editing supply chain data to identify bottlenecks and optimize logistics.
- IT Network Management: Editing graphs to add and update network devices in real-time.
- Fleet Management: Editing graphs to track vehicle routes, fuel consumption, and maintenance schedules.
- Logistics Optimization: Visualizing and updating shipping and delivery data to optimize routes and reduce costs.
Graphics Specialized for Your Graph Data Application
Perspectives is optimized with high-speed graphics capabilities and HTML5 canvas graphics to create the best in class graph visualizations for your application. You can use Perspectives HTML classes embed the visualization components into your web application and when the HTML class is assigned to any HTML tag, such as <span> or <div>, the tag will be interpreted as a component, regardless of its type.

Create nodes and edges
Perspectives provides editing tools that can be incorporated in your application for end users to add nodes and edges to graphs:
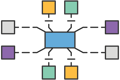
- At Tool — the user clicks a location in the drawing view to create a new node. Configure multiple At tools for users to add different node types.
-
Between Tool — the user clicks a source node and then drags the mouse to the target node to create a new edge.

The At Tool adds a node to a graph drawing.
Edit attributes in-place
Perspectives supports in-place editing of text attributes in the inspector, tables, and nodes in the drawing view, streamlining end users' experience.

In-place attribute editing supports advanced data analysis and interaction.
Change edge connections
Using the Reconnect Tool, users can drag one end of an edge to a new node to change the source or target node of an existing edge.

The Reconnect Tool moves an edge between two nodes in a graph drawing.
Transfer a node between nested graphs
The Transfer Tool allows your end users to move nodes from one nested graph to another.

The Transfer Tool moves a node from one nested graph to another.
Delete nodes and edges from graph drawings
Users can quickly and easily remove extraneous elements from their graphs so they can focus on the important details. Users select the elements in the drawing view that they want to remove, and click the Delete icon.

The Delete Tool allows users to remove extraneous elements from a graph drawing.
Graph editing is integrated with powerful layout and data commit capabilities
Once users have edited the graph drawing, they can take advantage of powerful Perspectives' capabilities to clean up the drawing and write back changes to the database.

Smooth transitions during dynamic interaction
