What are knowledge graphs?
Knowledge graphs describe the world we know in the same way that we make sense of the world—by describing the connections between things. Like our brains, knowledge graphs take facts and link them meaningfully with related physical or logical concepts that matter to us, so that we can organize what we know and use that knowledge effectively.
In a knowledge graph, entities like people, places, objects, and concepts, are represented as nodes where each node stands for a unique entity. The connections or relationships between these entities are represented as edges. These relationships can be diverse, such as "works for," "located in," or "similar to." These entities and relationships are then structured in a graph format.
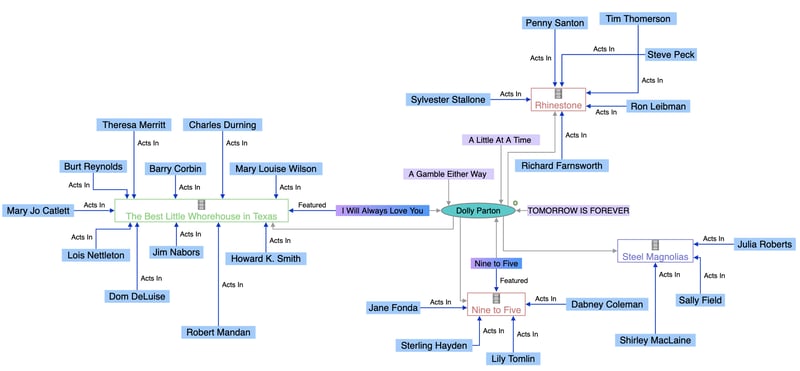
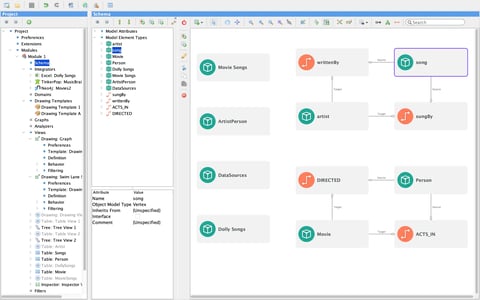
A knowledge graph with actors, movies, songs and artists (nodes) and their relationships (edges).

Familiarity
Knowledge graphs organize information into a node-edge structure that is similar to the connections our brains make when we build up knowledge about the world, unlike relational databases that force data into a rigid tabular form with keys to other tables.
Knowledge graphs can also supply data using the language that users recognize, even if legacy databases have used arcane or out-of-date data labels.
Knowledge graphs make data and connections more accessible and familiar to people and other systems.

Flexibility
Knowledge graphs grow organically as new information is discovered. Like our brains, knowledge graphs make room for any new information when it becomes available.
Because the knowledge graph is there, further knowledge discovery is possible. New knowledge can be inferred semantically, identified with graph algorithms, or supplied by your enterprise social network.

Accessibility
Linked data and knowledge graphs provide context for other people and systems in your enterprise to correctly interpret and apply the graph to serve your business.
By overcoming data silos, your enterprise knowledge graph becomes the graph platform for faster business applications development, more informed data science, and more effective decision support.
Knowledge graph systems help find the edge that matters
When information about your critical assets is in different data silos, it can present major challenges for stakeholders to find and connect all the relevant data they need. Consider these scenarios where knowledge graph systems assemble enterprise knowledge and help find the edge that matters.
Finance
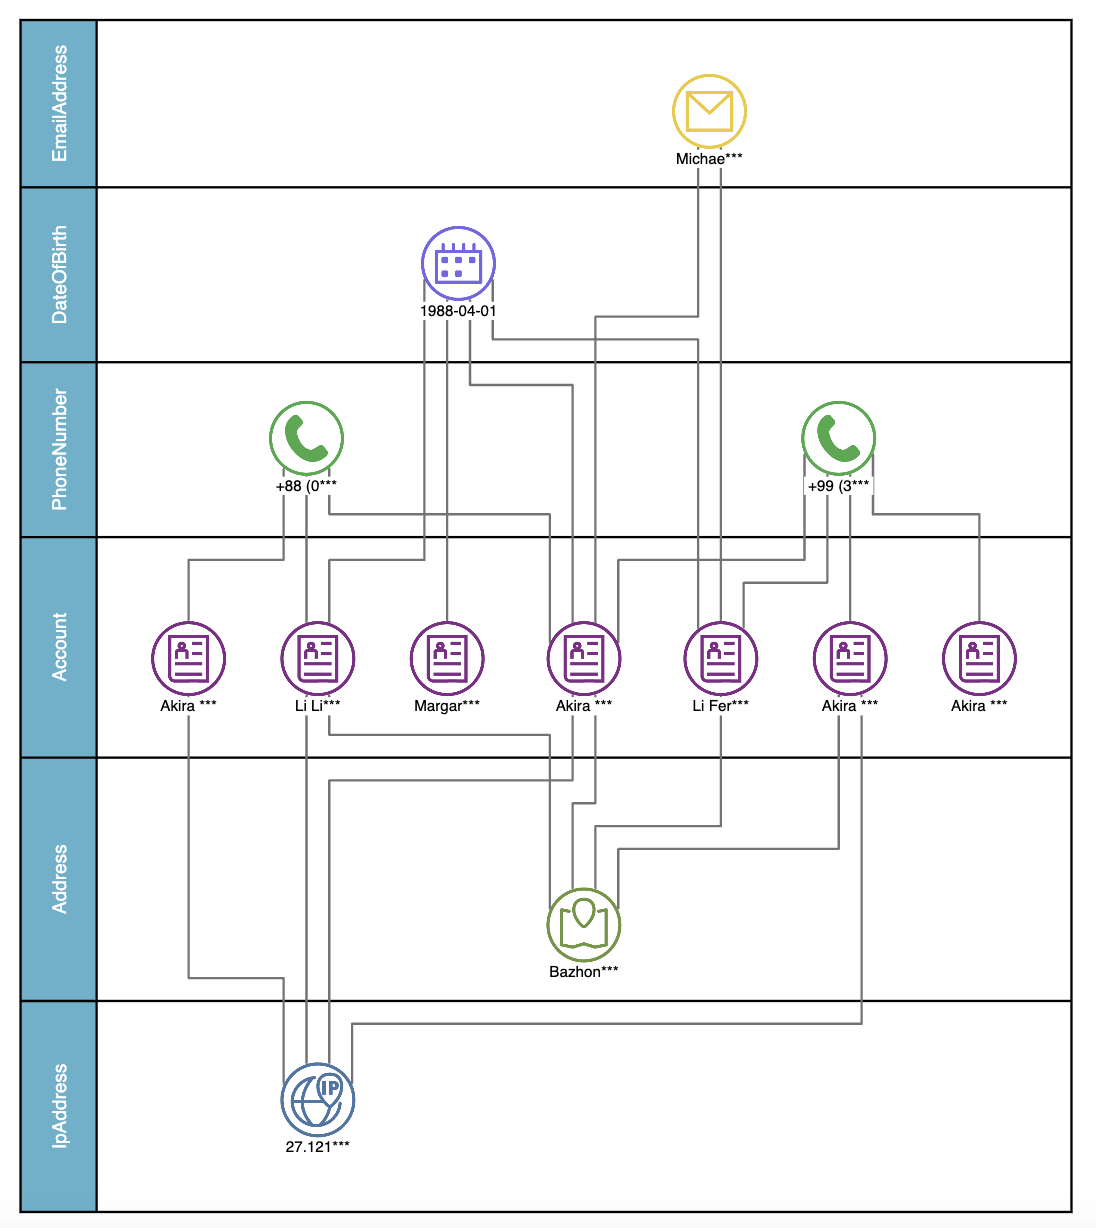
Knowledge graph systems in finance provide deep insights, enhance risk management, improve compliance, and support strategic decision-making. A knowledge graph can help you make the right connections.
- A third-party maintains critical assets in your network, but are they really delivering the services you are paying for?
- Can you better optimize the lifecycle costs of this asset?
- Can you link the maintenance records with your production records to see if a lack of timely maintenance is causing downtime?
Operations
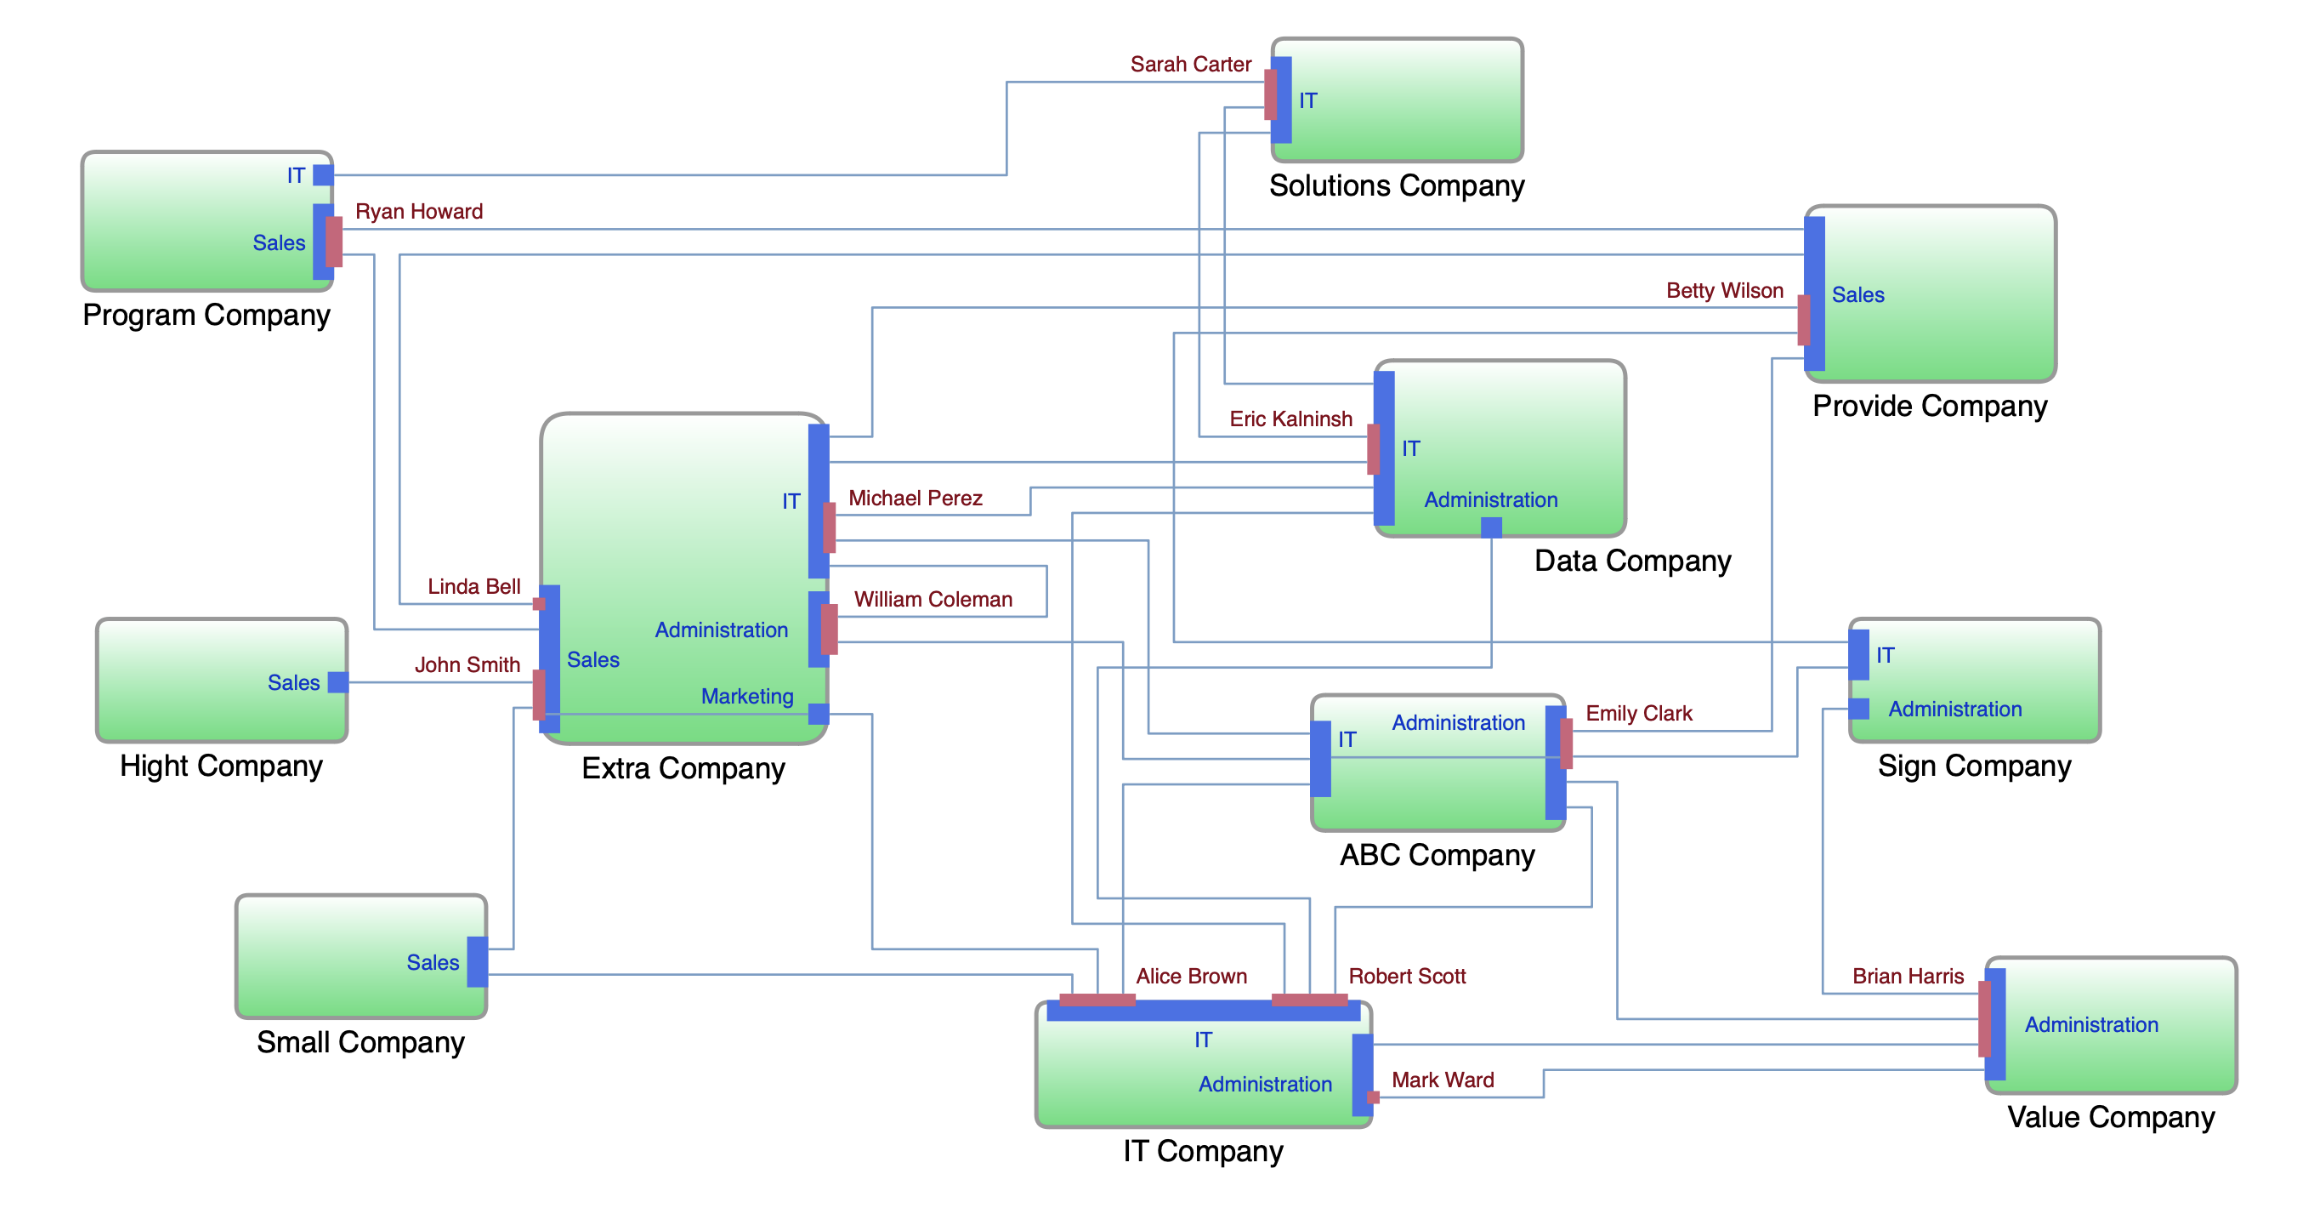
Knowledge graph systems play a crucial role in enhancing operational efficiency, reducing risks, and driving continuous improvement.
Did you know that assets have a social network? A knowledge graph can ensure that you have a clear picture of the impact an asset has on your operations and business stakeholders.
- Is this asset critical to the function of a network of other assets in your facility?
- Exactly what functions or departments depend upon it?
- Should you repair or replace this asset to make the network function more effectively?
Production
Knowledge graph systems are crucial in plant operations and production floors for optimizing processes, enhancing decision-making, reducing costs, and improving overall efficiency and productivity. Knowledge graph systems make answering these questions possible:
- Can you trace product quality issues back to this asset?
- Can you associate the maintenance history with the production history?
- What are the regulations about the operation of this equipment?
- Are any plant floor injuries related to operating this asset?
Supply Chains
Knowledge graph systems enhance the agility, efficiency, and resilience of supply chain operations by providing a deep, interconnected understanding of all its elements. Knowledge graphs hold the keys to these questions:
- Where does this asset fit in your supply chain?
- What impact does the asset have on the overall health of the chain?
- Can you utilize the asset more effectively?
- Is this asset the highest or lowest priority for the health of your supply chain?
Human Resources
Do you really know whether you have all the right people doing all the right things? Knowledge graph systems that helps you manage your most critical resources—your staff—can be the best investment you ever make.
- Does each team member understand their role and their business goals?
- Can you spot redundancies in your processes?
- Do you have the right people in place to make the right decisions?
- Are your incentives sensible?
Read more in the case study below.
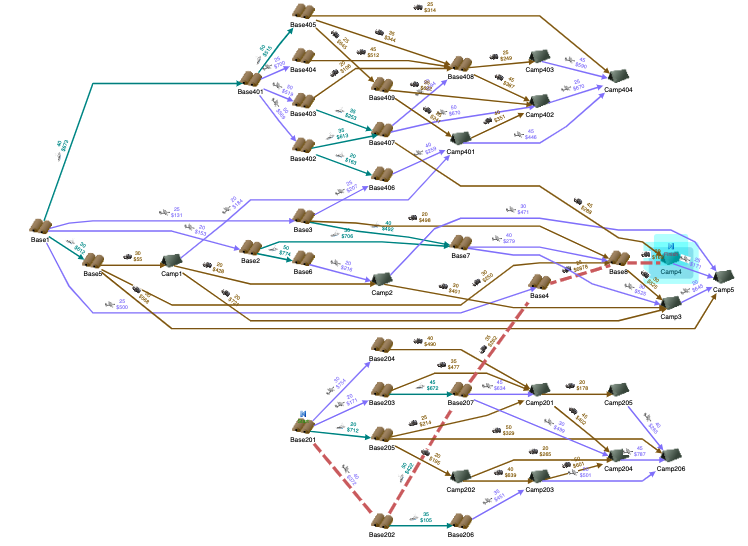
Logistics
Knowledge graph systems provide a dynamic and interconnected view of the entire supply chain, which is invaluable for navigating the complexities and logistics of modern global supply networks. They can help streamline the complicated dance of moving product from the factory floor to the consumer, understanding bottlenecks, and optimizing the reliability of your network.
- Is your flow of raw material to the factory secure?
- Do you have enough room to hold the inventory coming off the production line?
- Can you move the product from the factory to the distribution center fast enough to meet demand?
- Where are your most or least reliable shipping partners?
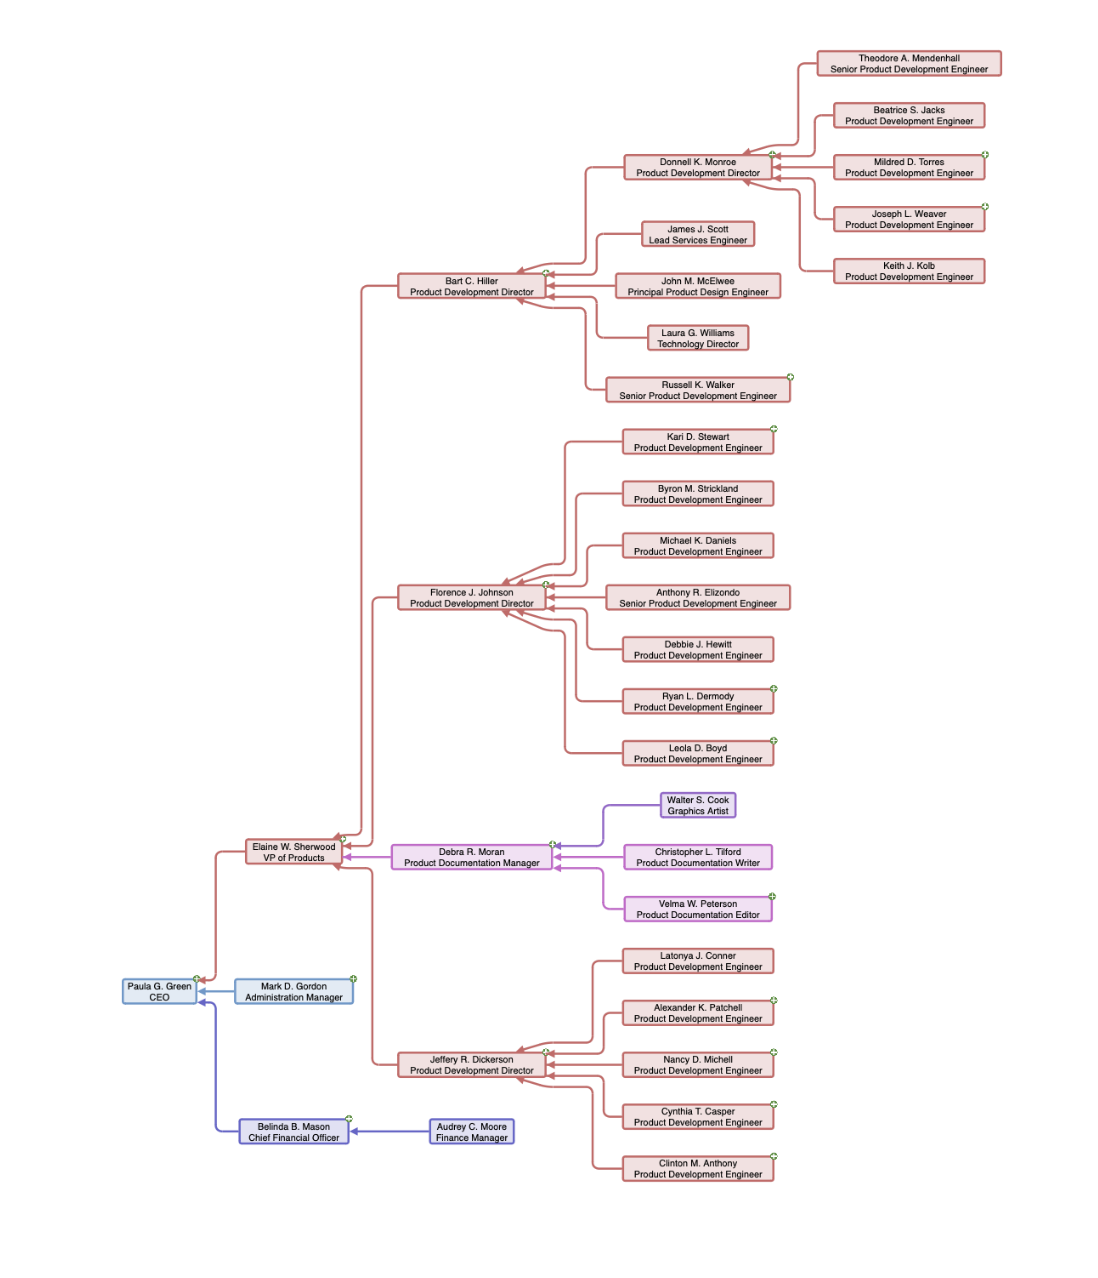
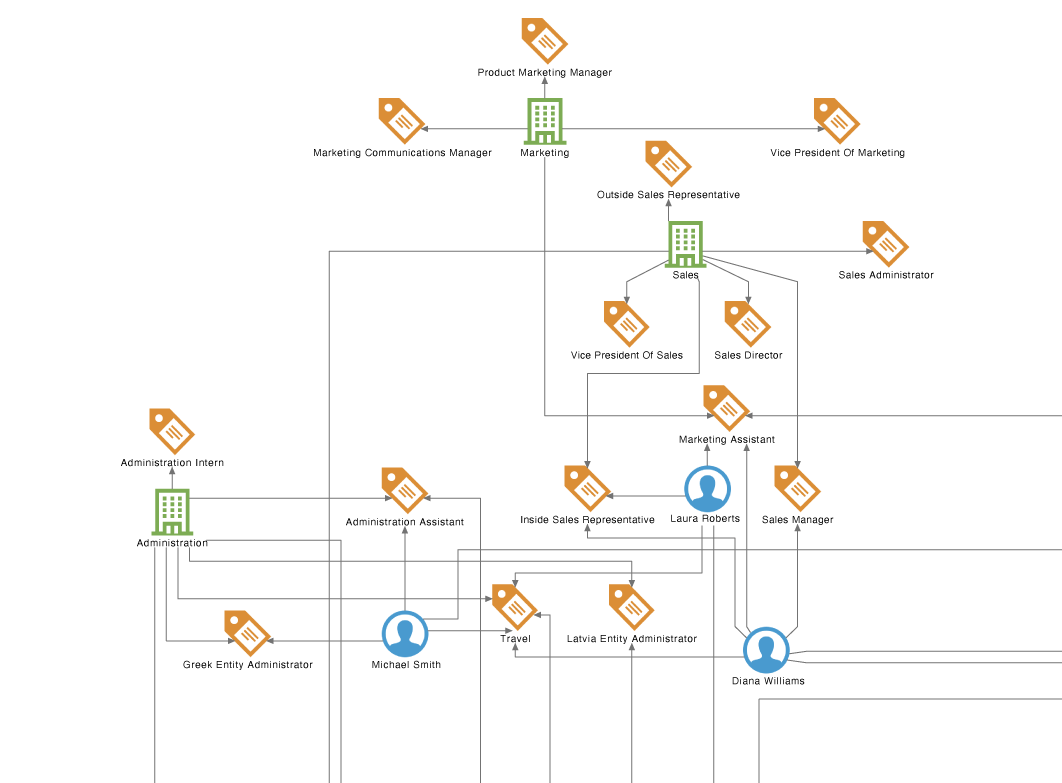
Case study: How OGraph transformed organization management
After helping over 200 companies streamline and clarify their organizations, Walt Brown discovered that all employees should be able to answer 14 basic questions about their job. Questions such as what is the purpose of my job, what skills do I need to advance, and what systems do I interface with and need to master?
After honing his ideas, Walt Brown employed Tom Sawyer Software services to translate his vision of OGraph into a full-fledged SaaS graph application.
A simplified example
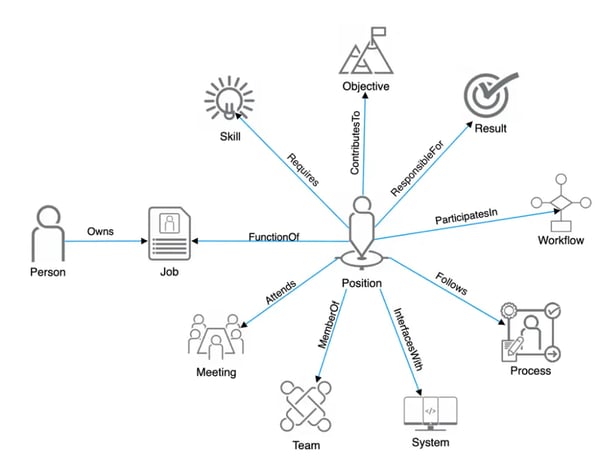
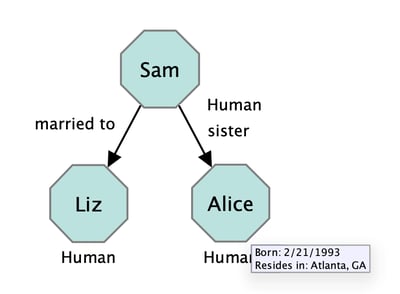
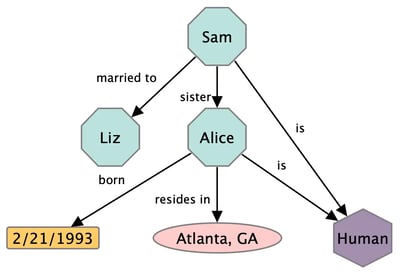
In the following example images, the labeled property graph on the left represents the "Human" type as a node label, and the "birthdate" and "resides-in" properties are represented as a tooltip.
In the semantic knowledge graph on the right, the labels and properties for "type," "birthdate," and "resides-in" are all represented as nodes.
 .
. 
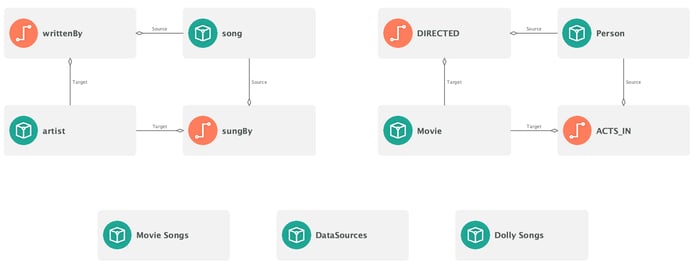
The Tom Sawyer Perspectives schema editor bridges the gap between information silos to build the knowledge graph you need.
Keep your options open
With Perspectives, you aren't locked into one approach for your enterprise data. With its in-memory graph and runtime APIs, it's easy to ignore data silos and present what your users or systems need to be efficient and effective.
Perspectives allows you to explore your options before you make a long-term commitment to a new enterprise data storage vendor.
- Break down functional data silos.
- Merge data from multiple knowledge graph databases.
- Unlock hidden enterprise knowledge.
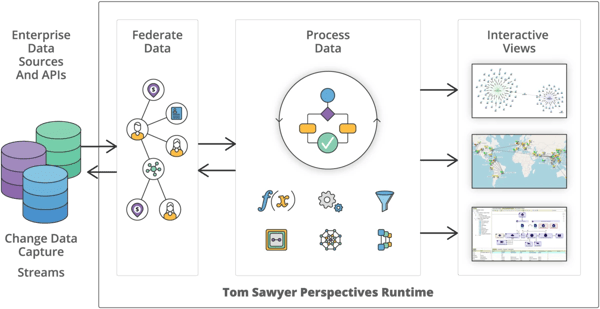
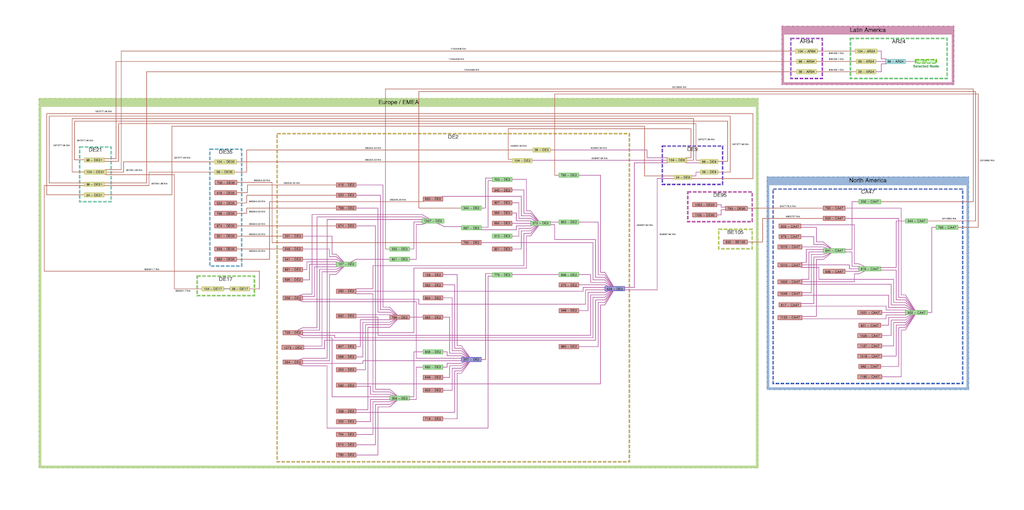
Perspectives graph platform enables enterprises to produce interactive knowledge graph visualization and analysis applications from federated data.
Supported knowledge graph databases
Tom Sawyer Software can help you build an in-memory knowledge graph no matter where your data is stored. Perspectives can provide a graph application development layer on top of your knowledge graph database, with integrations for Neo4j, Neptune, and Apache Tinkerpop-style knowledge graph databases. Perspectives also has a built-in integrator for RDF data sources using SPARQL query language.
We work with all of these knowledge graph databases and interfaces, as well as a host of other legacy data sources.


Seamlessly federate data from your information silos into a unified Perspectives schema.
Visualize the federated data using knowledge graph drawings, charts, tables, trees, and more.
Extracting value from your knowledge graph
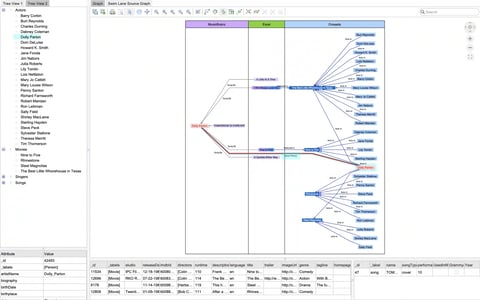
With the knowledge graph schema linked to connected business data, use Tom Sawyer Perspectives to address your business needs with user-centered dashboards to navigate connected information.
- Deliver all the context that is required to assess a situation and address it effectively.
- Reveal hidden connections and enable smooth navigation in every direction.
- Combine methods of visualization that show a problem from all sides to support effective resolution.
- Find the edges that give you the leverage to solve business problems.


Visualize analytics with multi-dimensional knowledge graphs
Graph analytics and knowledge graph visualizations deliver insights that statistics can mask or ignore. A knowledge graph can provide the context that turns complex analyses into solutions to big problems.
Knowledge graphs support experts in fields like physical sciences or social engineering to identify patterns and find new solutions to tough problems.
Graph-based knowledge graph visualization can help to explain what is behind the result of a complex algorithm, such as machine learning, and represent information about our amazing and complex world in context. Not only are you able to visualize the answer—you can see the downstream impact of the decision about to be made.
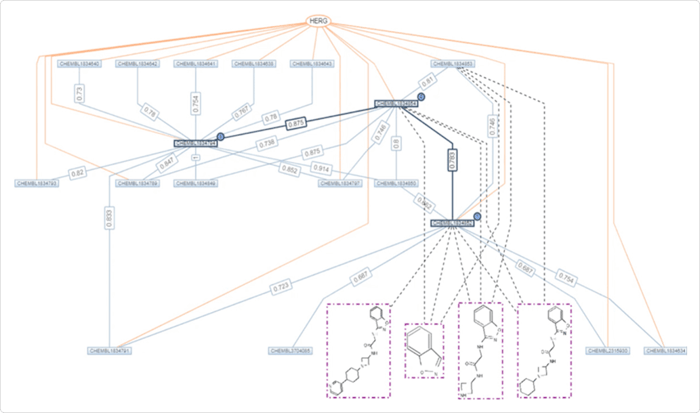
A chemical similarity analysis application utilizing different imagery and treatment for different types of entities to aid understanding.
Knowledge graph exploration for everyone
Analysts need the ability to freely explore knowledge graphs, regardless of their technical expertise with query languages.
Perspectives' Pattern Matching Query Builder greatly simplifies the task of advanced graph pattern searches without the need to know the SPARQL, Gremlin, or Cypher query languages.
Using the visual query builder, analysts can build the patterns they want to visualize for maximum flexibility that is accessible to everyone.

Perspectives' Pattern Matching Query Builder enables exploration of knowledge graphs without the need to know SPARQL, Gremlin, or Cypher query languages.