Tom Sawyer Digital Engineering is a modern, web-based product suite built on a knowledge graph architecture that connects planning, processes, engineering models, supply chain information, and other enterprise data in a shared environment. Unlike large engineering systems assembled from disconnected applications and data silos, Tom Sawyer Digital Engineering is designed around a connected data foundation, using open-source ArcadeDB to support integrated information across the engineering lifecycle.
State-of-the-art graph and data visualization and analysis brings complex engineering information to life through interactive views of flows, networks, models, dependencies, and swimlanes. For manufacturing organizations, the suite supports the engineering V-model by helping teams visualize relationships across planning, design, implementation, verification, and related processes while understanding the downstream impact of change.
Tom Sawyer Digital Engineering integrates advanced digital technologies and engineering methodologies, revolutionizing how engineering projects are conceptualized, planned, and executed.
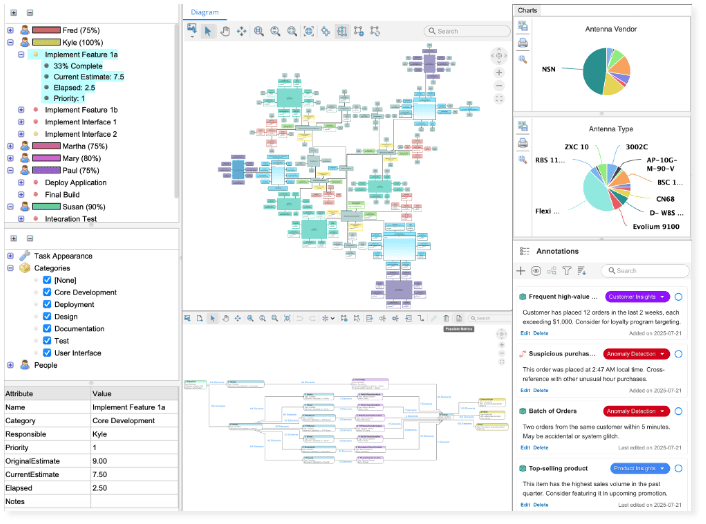
Tom Sawyer Digital Engineering provides the authoritative source of truth across engineering systems for traceability, impact analysis, planning, and better-informed decision-making.
Trusted by science and industry leaders







Challenges in the digital engineering lifecycle
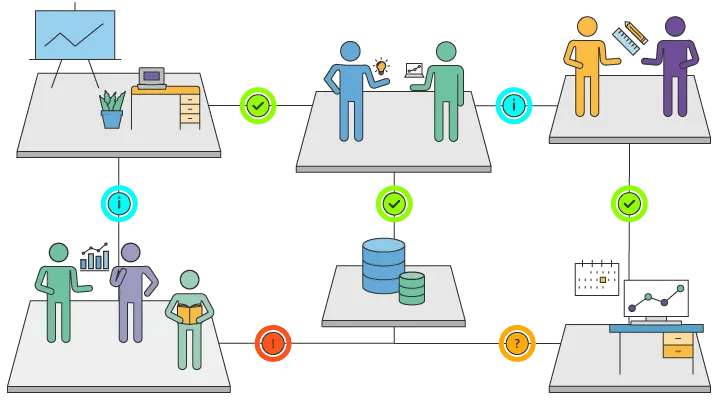
Whether your role is in Systems Engineering, Product Development, or Enterprise IT, management of your critical systems encompasses many concerns, and involves many stakeholders and their specific requirements.
Analyzing and visualizing connections through many digital layers, competing concerns, and across time is critical to managing robust products and networks, and critical to guiding team members to the right decisions. If those teams are separated by digital chasms, your digital engineering tools might be working against your goals.
Tom Sawyer Planning enables complex planning for dependency and change-impact analysis
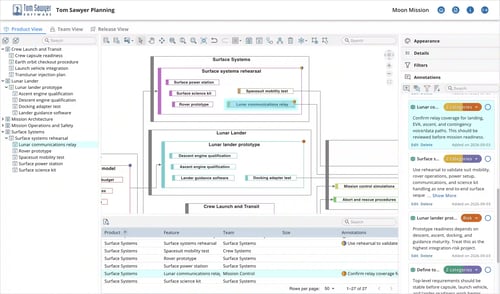
Tom Sawyer Planning is a visual planning application for defining and managing strategic initiatives, products, features, releases, teams, and their dependencies within a shared planning model. Unlike conventional planning tools that rely primarily on linear Gantt charts, Tom Sawyer Planning uses powerful graph and data visualization and analysis to show complex plans as interconnected, nested drawings that reveal hierarchy, flow, and dependency relationships.
Tom Sawyer Planning gives product managers, program leads, and project teams greater visibility into complex plans so they can understand dependencies, coordinate work, assess change impacts, and make better-informed planning decisions.
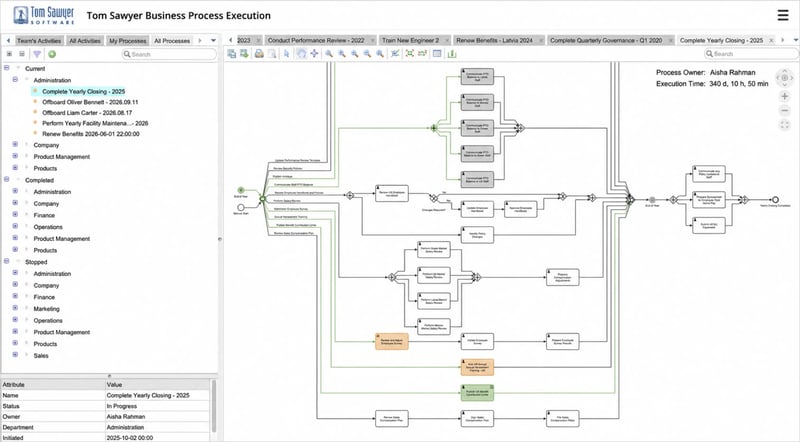
Tom Sawyer Business Process provides visual process modeling and execution
Tom Sawyer Business Process is an advanced business process design and execution application. It provides an intuitive, web-based interface for creating BPMN 2.0-compliant processes and has an integrated process execution engine to ensure processes are run precisely and consistently.
Tom Sawyer Business Process makes responsibilities clear and enables teams to track tasks and spot bottlenecks, so your entire organization runs smoothly and efficiently.
Tom Sawyer Model-Based Engineering mines SysML v1 model data and instantly generates diagrams
Tom Sawyer Model-Based Engineering quickly generates diagrams for your Block Definition, Internal Block, and Parametric Diagrams. The application mines the data that describes your SysML v1.0 model directly from model definitions in Teamwork Cloud on the web and in MagicDraw on the desktop, finds the elements and connections that need to appear in your diagram, and then creates it.
Tom Sawyer Model-Based Engineering saves systems engineers from hours of time manipulating incomplete and inelegantly arranged drawings to meet the demands of various stakeholders.
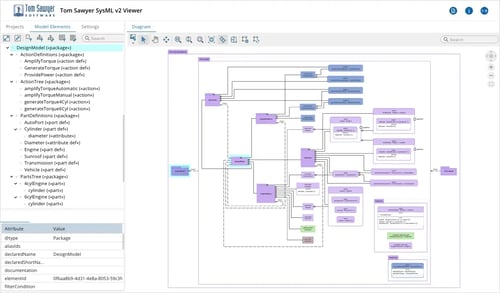
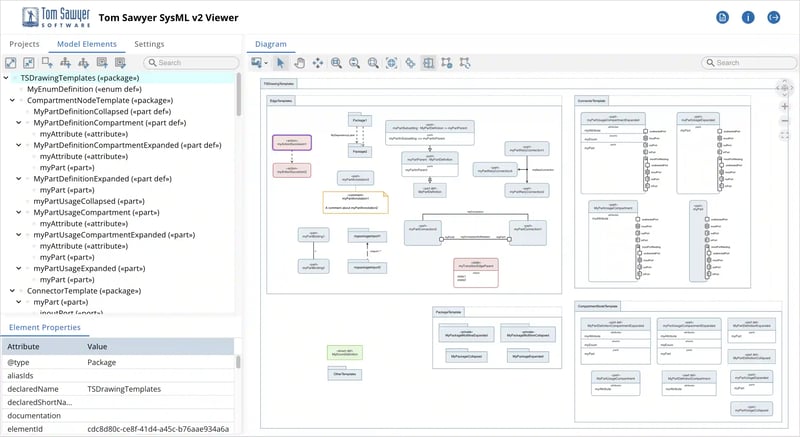
Tom Sawyer SysML v2 Viewer automatically generates visualizations of your SysML v2-compliant models
Tom Sawyer SysML v2 Viewer integrates with any repository that supports the SysML v2 API and services specification and provides interactive and customizable visualizations of your models.
Automatic layout, intuitive graph interaction, color-coding, and more provide systems engineers capabilities to efficiently explore and analyze complex intricate SysML v2 models and gain deeper insights.
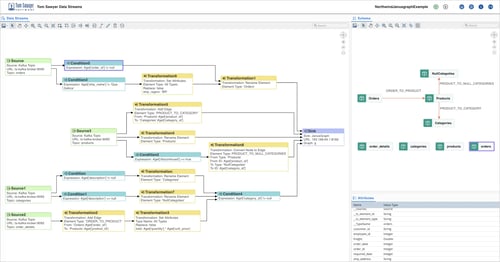
Tom Sawyer Data Streams ETLs multiple, diverse, and continuously evolving data sources into a knowledge graph
Tom Sawyer Data Streams is a schema-driven platform to ETL structured and unstructured data into a single, governed, query-ready knowledge graph. Subscribe to Apache Kafka (or Confluent) topics sourced from databases, files, and APIs; apply precise transformations and filters; then run flows continuously to normalize, enrich, and link changing streams in real time. Persist the knowledge graph in a graph database for scalable sharing and downstream analysis. Integrate with existing pipelines and catalogs, and use the graph as a high-quality context layer for AI, including RAG and reasoning.
Tom Sawyer Data Streams reduces integration efforts across legacy and streaming systems, fits existing pipelines and tools, and delivers a complete, accurate picture for lineage, impact analysis, and operational decisions.
Tom Sawyer Perspectives for creating custom knowledge graph visualization and analysis applications
Tom Sawyer Perspectives is a powerful, low-code development platform for building standalone applications or embedding advanced graph and data visualization and analysis into existing systems. It enables organizations to federate data from diverse sources—relational databases, graph stores, JSON, RDF, REST APIs, and more—and model it into a unified knowledge graph representation.
Tom Sawyer Perspectives supports deep data exploration and link analysis supported by superior graph drawings. With automated schema extraction, a rich suite of visual data analysis tools, code-free pattern-based querying, and customizable layouts, Tom Sawyer Perspectives transforms complex, connected data into intuitive, interactive knowledge graph visualizations that enable data-driven decision making.
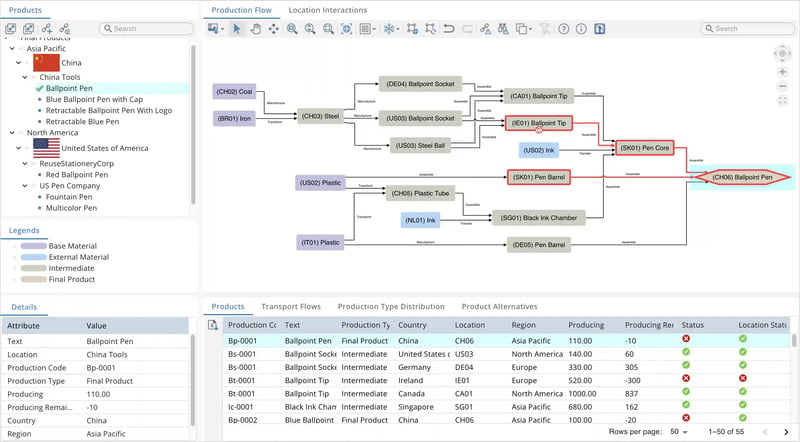
Tom Sawyer Explorations provides no-code queries and visualization of graph database data for non-technical users
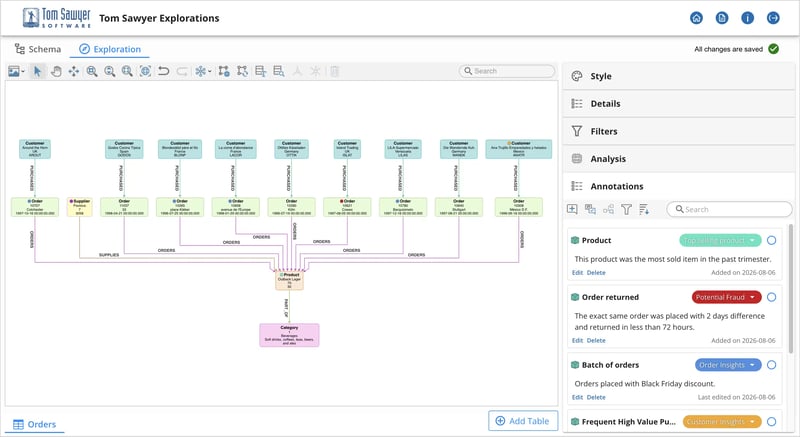
Tom Sawyer Explorations is a graph intelligence application that empowers analysts to rapidly uncover insights through data integration, graph pattern matching, and advanced graph visualizations and analysis—all without any coding and without having to know query languages.
Data professionals of all levels can easily connect to a graph database and construct a database query without needing advanced coding skills or knowledge of the Gremlin or Cypher query languages. Tom Sawyer Explorations automatically returns the query results in an interactive visualization of the relationships between elements meeting the search criteria and provides built-in graph analysis algorithms enabling a deeper understanding of the complex relationships within the data.
See how graph-based technology can uncover hidden failure patterns before they become costly or catastrophic

Built on an open graph database foundation
Tom Sawyer Digital Engineering uses ArcadeDB as its graph database backbone, providing a shared foundation for connected engineering information without adding another proprietary data silo. Because ArcadeDB is open source under the Apache 2.0 license, organizations can avoid separate database license fees and reduce the costs associated with commercial graph platforms.
For production environments, customers can add commercial ArcadeDB support with service-level commitments and priority assistance, combining open-source flexibility with enterprise support when needed.

ArcadeDB provides the open-source graph database foundation for Tom Sawyer Digital Engineering.
Benefits of Tom Sawyer Digital Engineering
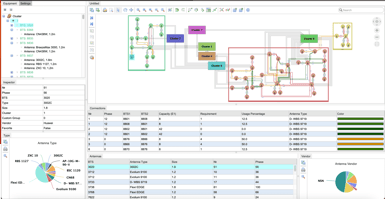
Break down engineering data silos
Connect information from existing engineering tools and repositories without disrupting the systems your teams already rely on. Tom Sawyer Digital Engineering helps bridge those sources so related information can be viewed and used together rather than remaining isolated within individual applications.
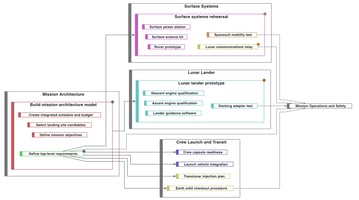
Understand dependencies and the impact of change
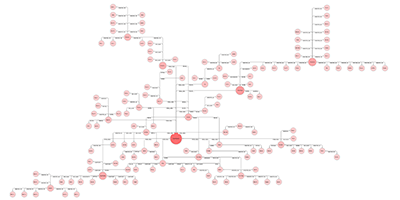
Follow relationships across plans, models, processes, and other engineering information to see how changes in one area may affect another. Interactive graph navigation makes it easier to trace upstream and downstream effects, investigate root causes, and identify potential conflicts earlier.
Improve lifecycle traceability and engineering quality
Connect information across the engineering V-model, from requirements, architecture, and design through implementation, integration, verification, validation, deployment, and maintenance. Tracing relationships across these stages gives teams greater visibility into how decisions and changes propagate. Better traceability helps users identify inconsistencies, investigate issues, and reduce the risk of unintended downstream effects.
Make complex engineering information easier to understand
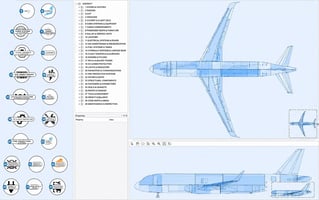
Use interactive graph and data visualizations to present systems, processes, and plans at the level of detail each audience needs. Logical and physical information can be viewed together, while automated diagrams, swimlanes, grouping, and drill-down capabilities help users navigate complexity without relying on manually maintained static drawings.
Give more stakeholders access to engineering insight
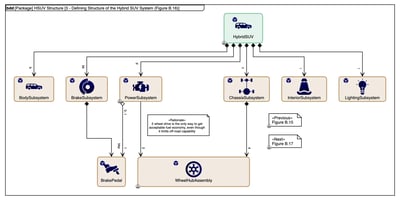
Engineering information is valuable beyond the engineering team. Connected visual views help business leaders and other stakeholders understand complex systems without requiring them to interpret specialized engineering tools or raw technical data.
Reveal insights and support better decisions
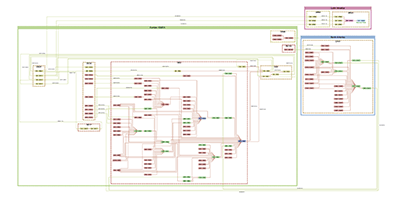
Graph analysis helps teams uncover relationships that can be difficult to see when information is spread across separate tools. Users can investigate alternatives, identify bottlenecks and risks, and better understand how decisions may affect cost, quality, and performance.
Investing in the future of digital model-based engineering
Our commitment to SysML v2
SysML v2 is an important step for the future of Model-Based System Engineering (MBSE). We are delighted to have been part of the team that is shaping the future of digital system engineering through the leadership of the Object Management Group (OMG).
Every system is a graph, and automating graph visualizations based on digital engineering data plays a large part in helping humans to understand both the system design and operation at every level of detail.
Read more about how SysML v2 was informed by the benefits and challenges of SysML v1.
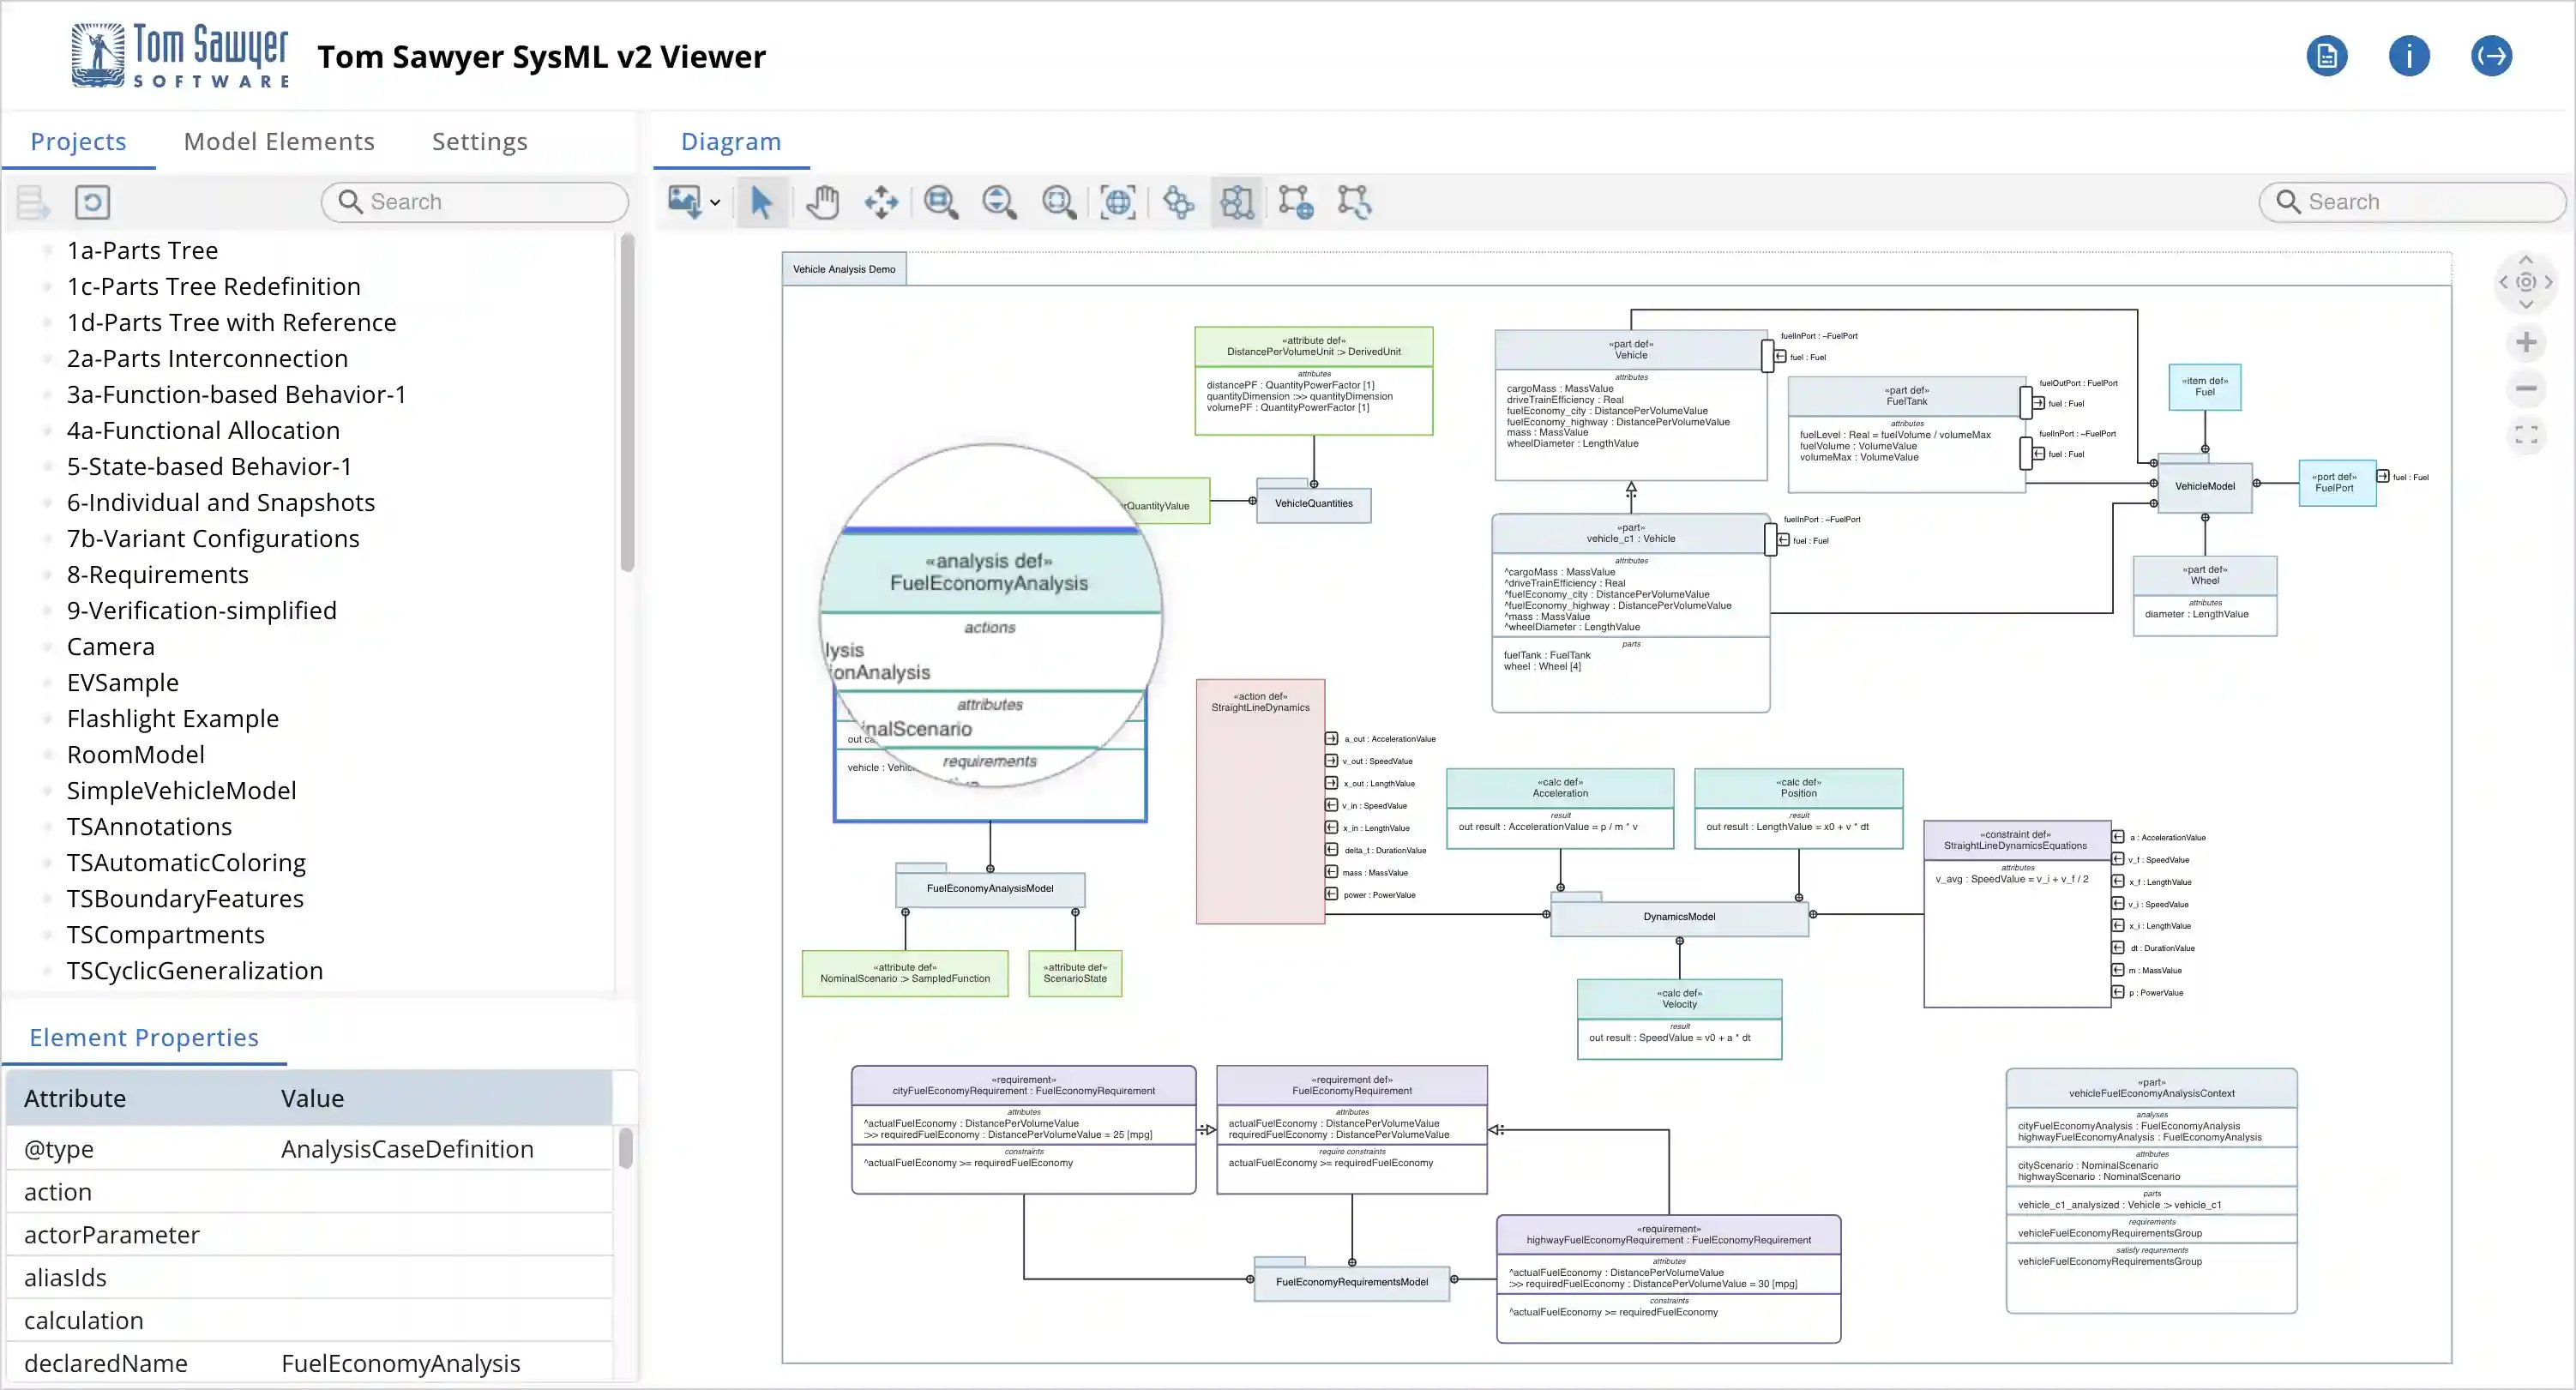
Tom Sawyer SysML v2 Viewer instantly generates clear and readable visualizations of systems models.