Telecommunications providers operate some of the world's most complex connected systems. Physical infrastructure, logical services, customers, network functions, and operational systems all depend on one another. Understanding these relationships is essential for maintaining network reliability, optimizing performance, and delivering high-quality services.
Tom Sawyer Perspectives helps telecommunications organizations transform complex telecom data into analytical models and interactive graph visualizations that reveal the structure, dependencies, and behavior of their networks.
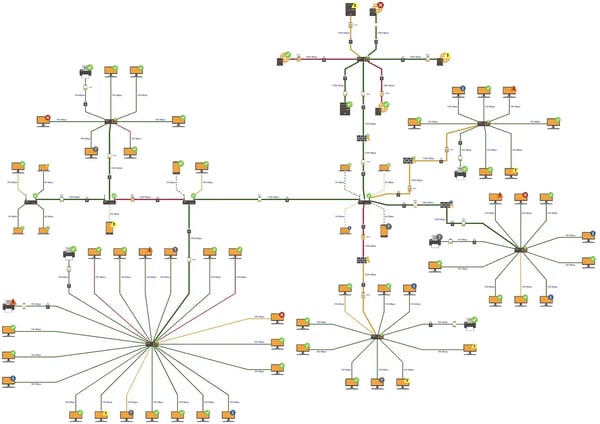
The Microwave Network Editor demo visualizes network topology, device status, link capacity, and potential service issues across a complex telecommunications network.
Tracing connections from infrastructure to customer impact
Telecom operations depend on understanding more than where network assets are located. Operators must also know which services depend on those assets and how failures, congestion, or planned changes may affect customers and operations.
Graph technology connects these layers of information, allowing users to trace relationships from physical infrastructure, through logical and service dependencies, to operational and customer impact. This provides a more complete view than separate GIS, inventory, and monitoring systems can offer.
Physical relationships
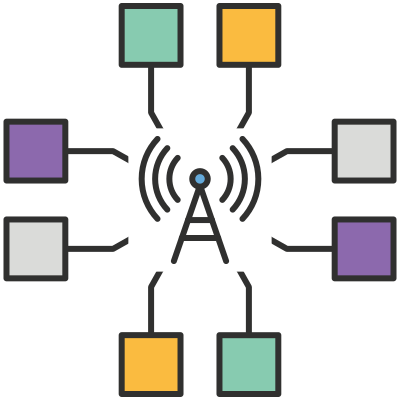
The hundreds of thousands of devices that make up a telecommunications network can be difficult to track and manage. Graph-based solutions are purpose-built to support efficient maintenance of these wide-scale networks, including device location, network bandwidth, and real-time incident management and mitigation.
Dependency relationships
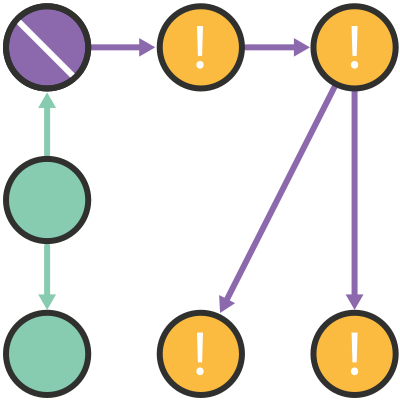
A myriad of services, software configurations, virtual functions, customer connections and third-party services are part of separate but connected relationship graphs on the physical network. Graph-based approaches are uniquely able to trace dependencies and detect the root causes of issues within these highly connected virtual layers.
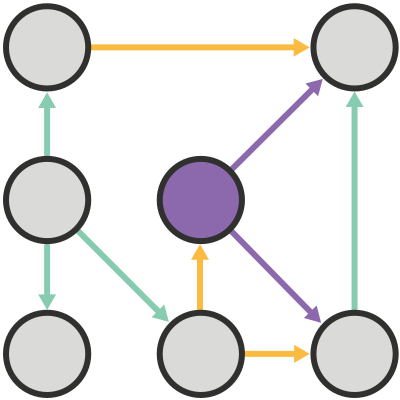
Impact relationships
Failure of one connected part of the network can have wide impact. Graph-based analysis helps to minimize planned and unexpected outages, identifying network contingencies to minimize disruption and manage service contracts. Identifying bottlenecks, rerouting traffic, and planning for network expansion are a few ways that impact analysis informs telecom operations.
Explore telecom networks as connected systems
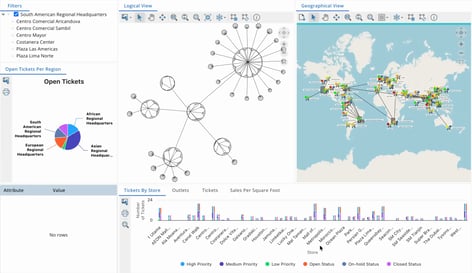
Build synchronized and interactive visualizations of connected networks with Tom Sawyer Perspectives that meet the demands for managing global, multi-layer networks.
Tom Sawyer Perspectives brings physical infrastructure, logical connections, services, and customer relationships together in coordinated, interactive visualizations. Users can move between network, geographic, schematic, and tabular views while maintaining the same operational context.
Selecting an asset, service, or customer in one view highlights the related information across the others, making it easier to trace connections, investigate dependencies, and understand the broader impact of network conditions or changes. Instead of piecing together information from separate systems and reports, teams can explore the telecom environment as a connected whole.
Network operations
Managing the day-to-day basic operations of a vast network involve visualizing the network topology and investigating service disruptions more efficiently.
Benefits
-
Faster root cause analysis
-
Reduced mean time to repair
-
Improved network reliability
Explore this hands-on example application yourself.
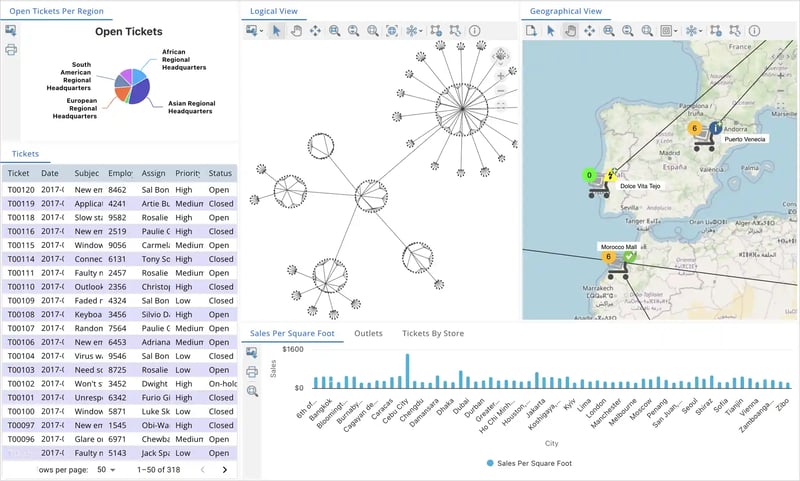
An example communication management dashboard for a world-wide retail network built with Tom Sawyer Perspectives.
Service assurance
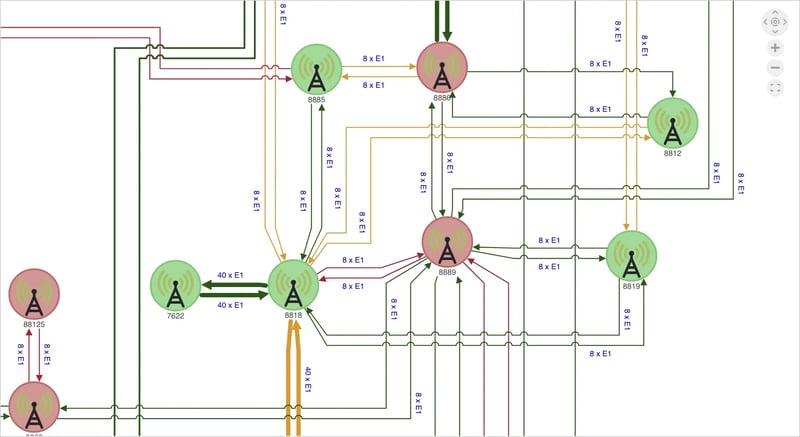
A graph produced with Tom Sawyer Perspectives showing load and capacity between towers in a microwave network.
Managing customer expectations in the face of network disruptions demands that an operator knows precisely how infrastructure issues will affect customers. Graph technology is uniquely suited to analyzing disruptions, identifying solutions for rerouting traffic, and delivering the information when and where it is needed.
Benefits
-
Faster service restoration
-
Improved SLA performance
- Better customer experience
Explore this hands-on example application yourself.
Network planning
Long-term management involves analyzing infrastructure relationships and capacity requirements, and planning for expansion, and eventual obsolescence of parts of the network. Visualize relationships among facilities, equipment, and maintenance activities.
Benefits
-
Improved asset utilization
-
Better maintenance planning
-
Lower operational costs
-
Better network utilization
-
Improved expansion planning
- Reduced operational risk
Explore this hands-on example application yourself.
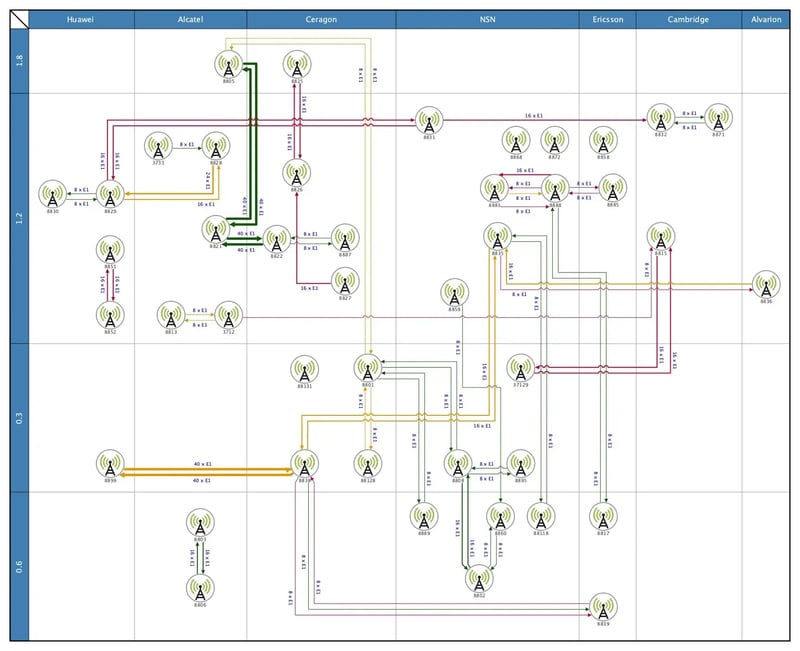
A swimlane analysis of connected devices in a microwave transmission network arranged by antenna type and manufacturer.
Security and fraud analysis
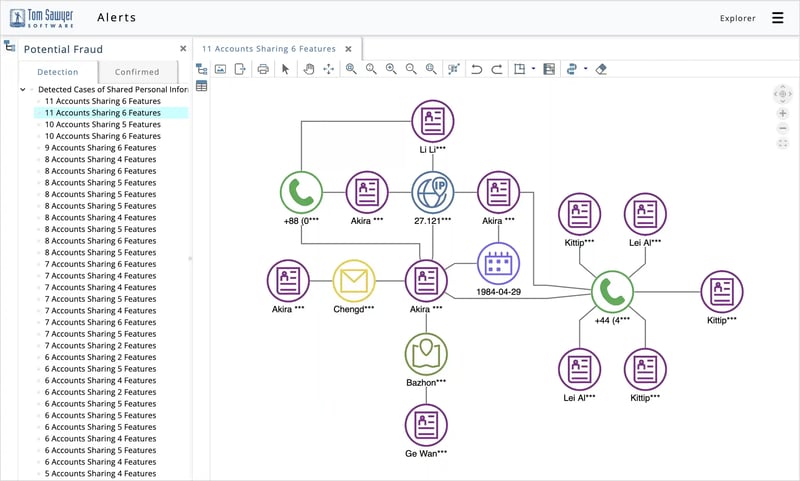
An example fraud analysis application built with Tom Sawyer Perspectives that visualizes a network of suspicious activity.
Telecommunications of all kinds are increasingly used to commit fraud against individuals, corporations, and connected networks of all kinds. Graph analysis techniques can assist in the identification of suspicious activity, hidden relationships, and bad actors.
Benefits
-
Improved threat detection
-
Faster investigations
-
Improved mitigation strategies
- Enhanced operational security
Explore this hands-on example application yourself.
Customer and subscriber behavior analysis
Using graph analytics, telecommunication providers can understand customer usage over time to identify behavioral patterns, usage communities, mobility trends, and demand drivers that influence network performance and business outcomes.
Benefits
-
Improve network planning
-
Optimize infrastructure investments
-
Support dynamic pricing strategies
-
Increase customer retention
-
Enhance service adoption
-
Improve customer experience
-
Forecast demand more accurately
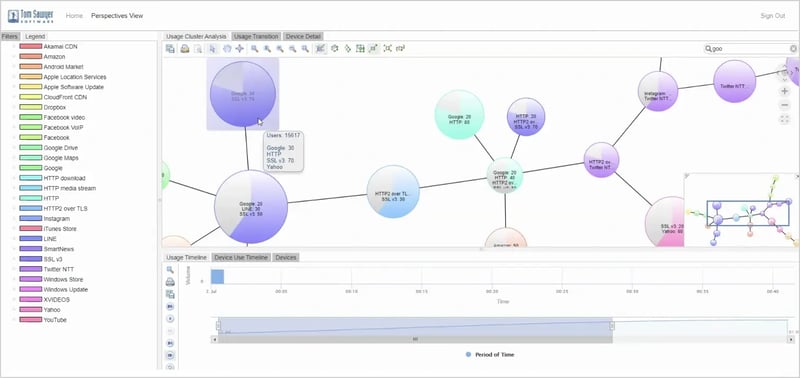
An interactive dashboard produced with Tom Sawyer Perspectives that uses color, size, and labeling to illustrate the volume of customers using cellular network services for specific purposes, and how those consumer patterns change throughout the day.
Digital twins for telecommunications
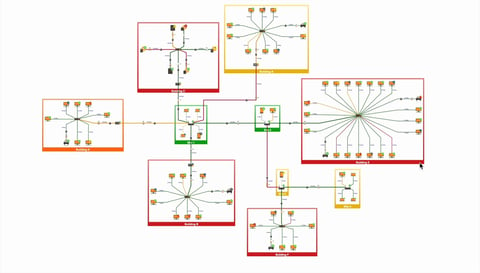
With Tom Sawyer Perspectives you can build a graph-based digital twin that connects telecom infrastructure, services, and operational data to support analysis and informed decision-making.
A graph-based digital twin provides a comprehensive representation of telecom infrastructure, services, and operational relationships. Tom Sawyer Perspectives enables organizations to create digital twins that combine graph visualization, graph analytics, and data integration within a single environment.
By modeling the network as a connected system, organizations can visualize network architecture, analyze service dependencies, simulate infrastructure changes, assess operational impacts, and make more informed planning and investment decisions.
Our telecom customers
Telecommunications companies around the world rely on Tom Sawyer Software technology to support their complex network visualization and analysis needs.
Featured partner: Trask Network Genius
Trask is a global technology company trusted by leading enterprises such as Société Générale, UniCredit Bank, KBC, Erste Bank, VW, Bentley, RWE and many others. Since 1994, it has been delivering technological innovations and large-scale transformations for leading companies in finance, insurance, telecommunications, energy, automotive and manufacturing. With 12 offices in 7 countries, Trask provides more than 150 global enterprise clients with critical managed services and innovative technology implementations.
Trask used Tom Sawyer Perspectives to develop Network Genius, a real-time network operations platform for telecommunications providers. Network Genius brings together network topology, alarms, configuration data, logs, and operational context to help operators visualize complex dependencies, identify root causes, assess service impacts, and resolve incidents more quickly.