What is the Tom Sawyer Software academic program?
The Tom Sawyer Software Academic Program offers free and renewable access to our industry-leading graph and data visualization software for researchers, professors, and students. Whether used for graduate theses, classroom projects, or academic research, the program empowers participants to analyze complex relationships and uncover insights using the same technology trusted by professionals worldwide.
Tailored for disciplines such as computer science, data analytics, cybersecurity, bioinformatics, and related fields, this program helps students and educators explore real-world data, build hands-on experience, and prepare for careers where understanding connections drives innovation.
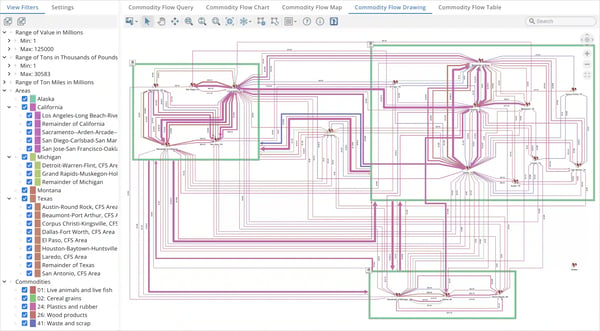
Tom Sawyer Software transforms your large and complex data set—no matter the data source—into dynamic and meaningful visualizations as seen in this graph-driven supply chain example.
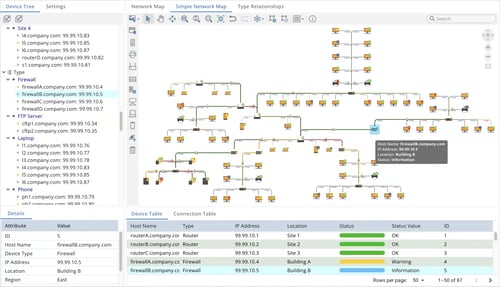
An example IT network analysis application built with Tom Sawyer Perspectives.
What is included with a free academic license?
A free academic license allows unrestricted access to all product features, along with comprehensive documentation.
Participants also receive complimentary technical support throughout the license period.
Participants can renew annually as long as they continue to meet the eligibility requirements.
Please reference Tom Sawyer Software in your academic work, conference presentations, and technical publications. We appreciate your assistance.
Eligibility requirements

Proof of enrollment
Participants must be currently enrolled as full-time or part-time students or faculty at an accredited university or college. Proof of active enrollment or employment may be required.

Valid school email address
Registration must be completed using a valid school-issued email address (e.g., .edu or institution domain) to confirm eligibility.

Download and install
That's all there is to it! Request an evaluation and once submitted, your request will be reviewed within 2 business days. If approved, you receive an email with the download and installation instructions.
Academic fields of study
Every discipline of study can benefit from applying graph-based analysis and communication. Here are a few examples in a cross-section of academic fields.

Chemistry
Graph-based solutions help students explore how structural properties like ring formation, branching, and connectivity determine a molecule's reactivity, and lets professors map multi-step reaction networks as directed graphs from reactants to products.

Economics
Trade relationships between nations, firms in a supply chain, or agents in a market can all be represented as nodes connected by directed edges representing flows of goods, capital, dependency, or influence. Graph analysis reveals which nodes are most critical, and most vulnerable to disruption.

Mathematics
Graph theory is a discipline unto itself, where students study the properties of nodes and edges directly: connectivity, paths, planarity, coloring, and traversal. A graph visualization and analysis platform helps them construct and manipulate these structures rather than just reason about them abstractly.

Medicine
Protein interaction networks map biological molecules as nodes with edges representing physical binding, a key aspect in drug discovery for identifying intervention targets. Disease transmission maps patients and pathogens as nodes, with edges representing exposure or contact.

Sociology
Social network analysis, mapping centrality, identifying brokers between clusters, or detecting echo chambers, is a primary research method, not just a visualization aid.

Computer Science
Cybersecurity benefits by graphing network vulnerabilities and attack paths, helping identify critical nodes before threats propagate. In cryptography, graph properties like adjacency matrices and connectivity enable innovative encryption schemes resistant to classical attacks.

Systems Engineering
Complex engineered systems such as aircraft, power grids, and software platforms are modeled as graphs where subsystems are nodes and dependencies or data flows are edges. Analyzing that graph reveals single points of failure (high-centrality nodes with no redundancy), failure cascade paths, and integration bottlenecks that aren't visible from component-level specs alone.

Biology
Gene regulatory networks map genes as nodes and activation or inhibition relationships as directed edges, letting researchers see how a single mutation can ripple through an entire biological system. Neural circuits, metabolic pathways, and ecological community structures are all similarly graph-shaped, making node-and-edge analysis central to modern biological research across scales from the cell to the ecosystem.

Administration
Stakeholder maps, merger integration planning, and supply chain risk analysis all benefit from modeling entities as nodes and relationships as edges, making visible who actually drives decisions versus who holds the formal title. Businesses run on processes, which are complex maps of shared responsibility.
Academic use cases
Leading universities successfully used our academic program to bring advanced graph and model-based technologies into the classroom and research lab. From hands-on student projects to cutting-edge graduate research, these institutions demonstrate how our tools help bridge theory and real-world application to empower the next generation of engineers, scientists, and analysts.

University of Crete
Students in a computer science course on complex network dynamics use Tom Sawyer Perspectives as part of their course project. The project involves developing a graph analytics server to visualize and analyze social networks, helping students explore real-world applications of graph visualization and analysis techniques in understanding dynamic, interconnected systems.

Politecnico di Milano
Graduate students in a space engineering master’s program use Tom Sawyer SysML v2 Viewer to analyze how the emerging SysML v2 standard can bridge systems engineering studies with budget analysis and high-level simulation. Their work demonstrates how advanced model visualization supports complex engineering research and has been featured in academic conference publications.