What is data integration?
Data integration is a common process in the modern data ecosystem that enables organizations to connect to a data source using a purpose-built connector to bring data into another system for further processing or analysis. This is crucial for businesses to utilize integration tools to derive actionable insights from their data to support decision-making and drive strategic initiatives.
Data integration automates and streamlines the management of data across systems. The data integration process encompasses a range of techniques and methodologies, including ETL (Extract, Transform, Load), data replication, and virtualization, to ensure that data, regardless of its source, can be accessed and analyzed in a consolidated manner.

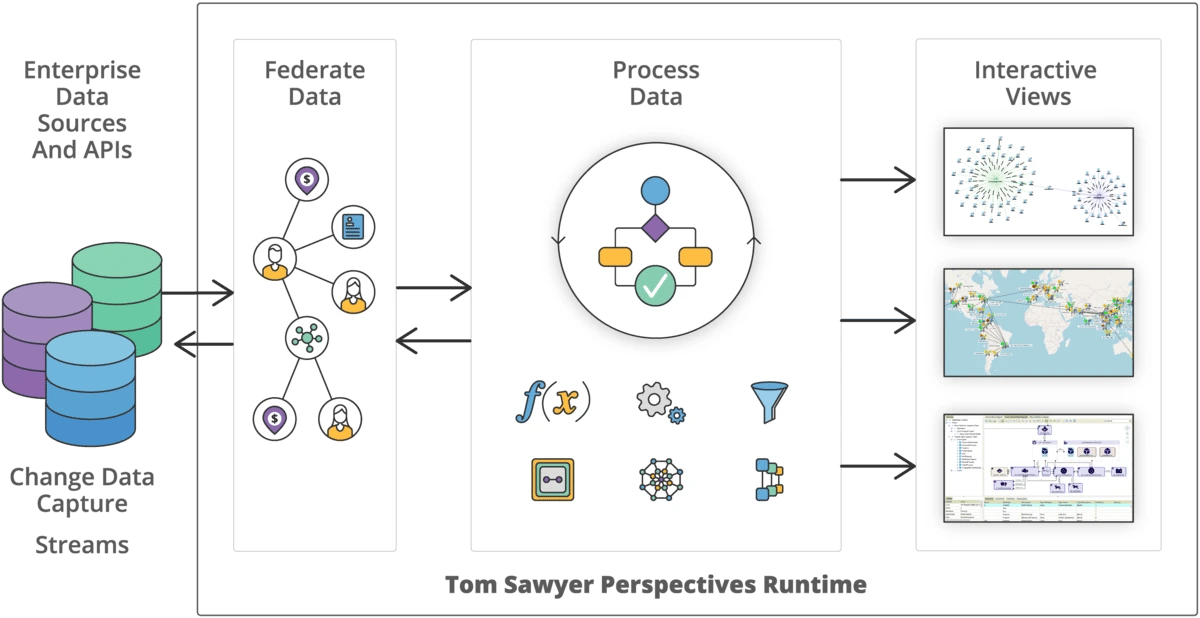
Data integration systems utilize connectors to integrate data into another system for further processing or analysis.
Considerations when choosing a data integration solution
Managing your data pipelines and choosing the right data integration platform can be a game-changer for your business. It can streamline operations, enhance decision-making, and unlock new opportunities for innovation. With the vast array of tools and technologies available, selecting a solution that aligns with your business requirements, technical capabilities, and strategic goals is crucial.
Consider these points as you evaluate data integration solutions.
Business Objectives and Requirements
Identify what you aim to achieve with the integration, such as improved data quality, real-time analytics, or streamlined operations.
Consider the types of data you need to integrate such as, customer data or financial data, and from which sources (e.g., CRM, ERP).
Data Volume and Complexity
Assess the volume of data that will be handled and the system’s capability to scale as data grows.
Consider the complexity of the data structures and the need for data transformation.
Integration Capabilities
Check if the solution supports different integration styles such as ETL (Extract, Transform, Load), real-time streaming, or batch processing.
Evaluate the ability to connect to various data sources and destinations, including cloud services, databases, and third-party APIs.
Performance and Scalability
Look at the performance benchmarks, particularly how the system performs under load.
Ensure the solution can scale horizontally or vertically based on future needs.
Compliance and Security
Determine the security measures provided, including data encryption and secure data transfer protocols.
Assess data governance capabilities, such as data auditing, lineage, and cataloging.
Ease of Use and Maintenance
Consider the user interface and ease of use for technical and non-technical users.
Evaluate the maintenance support offered by the provider, including customer service, updates, and patches.
Cost
Review the pricing structure, including initial setup costs, licensing fees, and ongoing operational costs.
Consider the total cost of ownership over time, including upgrades and additional services.
Vendor Reputation and Support
Research the vendor’s reputation in the market, their stability, and customer reviews.
Look at the level of technical support provided, including the availability of training resources and community support.
Flexibility and Customization
Check if the solution can be customized to fit specific business needs and how easily these customizations can be implemented.
Assess the flexibility of the solution to adapt to new technologies and integration patterns in the future.
Trial and Testing
If possible, conduct a proof of concept or trial to see how the solution fits with your existing systems and meets your integration needs.Our data integration solution is the key to your success
Tom Sawyer Software has spent more than three decades working with data and has a proven track record of providing solutions that address the data silo issue.
Our mature data integration platform, Perspectives, supports multiple data sources and formats providing the ability to integrate data from a wide range of sources, from graph and relational databases, to cloud services, APIs, and more.
Perspectives is capable of handling large volumes of data efficiently and scaling as your business needs grow.
Once integrated, Perspectives provides real-time access to a unified view of the data and capabilities to reveal valuable insights through powerful visualizations and analysis.
10
relational databases
10
graph databases
7
data formats
Supported data integrators
The Perspectives platform is data agnostic. It includes a comprehensive set of data integrators that can populate a model from a data source. Some integrators are a bidirectional bridge between a data source and a model, and support writing model data back to the data source.

Perspectives integrators can access data in one or more of these sources:
- Graph databases, such as Neo4j, Amazon Neptune openCypher, and Kuzu
- Graph databases supported by the Apache TinkerPop framework, such as Amazon Neptune Gremlin, Microsoft Azure Cosmos DB, JanusGraph, OrientDB, and TinkerGraph
- Microsoft Excel
- MongoDB databases
- JSON files
- RDF sources, such as Oracle, Stardog, AllegroGraph, and MarkLogic databases and RDF-formatted files
- RESTful API servers
- SQL JDBC-compliant databases, including Microsoft SQL Server, MySQL, Oracle, and Postgres
- Structured text documents
- XML
Data integration is easy with Perspectives
Whether you have a traditional relational database, a schema-less graph database or RESTful API, the data integration process is easy with Perspectives.
For relational databases
The data integration process is easy for relational databases. Follow these three simple steps, then repeat as needed.
Connect to your data source
Use the provided integrators to connect to your data source.
Extract the schema
Use automatic schema extraction to read the structure of your data and pull out the metadata information automatically. Use the schema editor to view and manually adjust the Perspectives schema to match your application needs.
Bind the data
Bind the data source and the schema. This process determines how many model elements of each model element type are created in the model, and determines the values of all attributes in the model.
Repeat
Repeat the steps to connect to as many data sources as you need.
For graph databases
For graph databases, Perspectives supports automatic binding by default. This means you can use a query to preview the database content and then visualize the data in a drawing view without manually creating a schema and defining data bindings.
The dynamic data integration tool in Perspectives allows you to integrate your data in about 20 seconds. From there you can springboard from a Cypher or Gremlin-compatible database to a fully customized, interactive visualization application in only 100 seconds more!
Neo4j integrator
The Neo4j integrator populates a model from a Neo4j database using the Bolt protocol or Neo4j REST API. If you use the integrator with the Bolt protocol, you can automatically create a Tom Sawyer Perspectives schema where the data bindings work as follows:
- Element bindings correspond to a read Cypher query.
- Attribute bindings correspond to a column in the result set of the Cypher query.
Neptune Gremlin integrator
The Neptune Gremlin integrator populates a model from an Amazon Neptune database that supports a Property Graph model. The Neptune integrator automatically creates a Tom Sawyer Perspectives schema where the data bindings work as follows:
- Element bindings correspond to a Gremlin query.
- Attribute bindings correspond to a column in the result set of the Gremlin query.
Neptune openCypher integrator
The Neptune openCypher integrator uses the Bolt protocol to populate a model from an Amazon Neptune openCypher database that supports a Property Graph model. With the integrator, you can automatically create a Tom Sawyer Perspectives schema where the data bindings work as follows:
- Element bindings correspond to a read Cypher query.
- Attribute bindings correspond to a column in the result set of the Cypher query.
TinkerPop integrator
The TinkerPop integrator works with TinkerPop-compliant graph databases such as TinkerGraph, JanusGraph, and Neo4j-Gremlin. You should also use a TinkerPop integrator for OrientDB Server version 3.0 or earlier. The Tinkerpop integrator can automatically create a Tom Sawyer Perspectives schema where the data bindings work as follows:
- Element bindings correspond to a Gremlin query.
- Attribute bindings correspond to a column in the result set of the Gremlin query.
Kuzu integrator
The Kuzu integrator populates a model from a local Kuzu database. The Kuzu integrator automatically creates a Tom Sawyer Perspectives schema where the data bindings work as follows:
- Element bindings correspond to a read Cypher query.
- Attribute bindings correspond to a column in the result set of the Cypher query.
Element Bindings
Element bindings correspond to:
- A URL, either full or relative to the base URL. The value of a URL is defined by an expression.
- A request method, one of GET, POST, HEAD, OPTIONS, PUT, DELETE, or TRACE.
- An optional request body. The value of a request body is defined by an expression.
- An absolute XPath location path. An XPath location path uses XML tags to identify locations within the XML response.
Attribute Bindings
Attribute bindings correspond to a relative path starting from the location path for element bindings.
Writing back changes to the data source
Perspectives supports the full data journey, from integration of your data, graph visualization, and graph editing, to writing back changes to the data source.
Support for most data sources
Perspectives can write data (commit changes) back to a Neo4j, Amazon Neptune, Kuzu, Apache TinkerPop, JanusGraph, or OrientDB database, or an RDF, Excel, SQL, text, or XML data source.
Worry-free integration
You don't need to worry about the various nuances and integration problems of each platform. Perspectives automatically handles that for you.
Maintains data integrity
During commit, Perspectives ensures data integrity.
Conflict detection and resolution
Perspectives detects and resolves conflicts during update and commit operations. A conflict occurs when the same object with the same identifier has mismatched values in the data source and in the model.
Commit configuration
With Perspectives, commit configuration is convenient and easy putting you in control of which changes to commit. By default, automatic bindings for Neo4j, Neptune Gremlin, Neptune openCypher, Kuzu, OrientDB, and TinkerPop integrators conveniently handle the commit operations to automatically save all changes. But you can choose to exclude any attributes from being committed. And the system supports regular expressions.
Learn more about the graph editing capabilities in Perspectives.
The benefits of data commit are clear
Perspectives provides all the advantages of model persistence while eliminating the pains associated with it.

Real-Time Updates
By writing changes directly to the original data source, you can provide real-time updates to the data without delays. This is particularly important in applications where up-to-date information is critical, such as financial systems, real-time monitoring, or collaborative editing tools.

Data Consistency
Writing data back helps maintain data consistency. When you update the data source immediately after modifying it, you ensure that all users or components working with that data see the same changes. This prevents data discrepancies or conflicts.
Historical Tracking
Committing changes in the original data source can provide a complete historical record of all modifications made to the data. This audit trail can be invaluable for debugging, compliance, and accountability purposes.

Scalability
In distributed systems, writing changes back to the original source can distribute the data updates across multiple nodes, improving the scalability and load balancing of your application.

Simplified Recovery
If a commit process fails midway, you can use the recorded changes to recover and reapply updates, ensuring data integrity.

Ease of Collaboration
When multiple users or systems interact with the same data source, writing changes back simplifies collaboration. Everyone sees the same data state, reducing confusion and conflicts.

Reduced Latency
In cases where data retrieval is time-consuming (e.g., fetching data from external APIs or databases), persisting changes locally can reduce latency by avoiding repetitive data fetches.

Easier Rollbacks
If a change leads to unexpected results or errors, reverting to the previous data state is more straightforward when changes are already stored in the original source.

Adherence to Data Policies
In scenarios with strict data governance or compliance requirements, writing changes back to the original data source ensures that data policies and access controls are consistently enforced.
Applying visualization and analysis to your data
Once your integrators are configured in Perspectives, the data is loaded into our in-memory native graph model which makes it effective and efficient to work with the data.
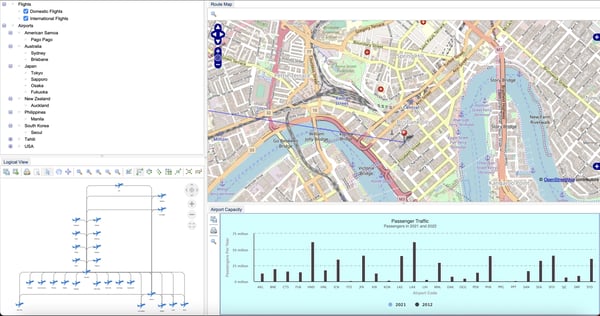
Perspectives makes it easy to design and configure an end-user web or desktop application that utilizes the graph model so your users can access the data in real-time. You configure easy-to-understand views of the data including graph drawings, tables, charts, timelines, maps and more. You can also incorporate powerful analytics into the resulting application so users gain even more insight into the data.
Watch this video to see how easy it is to configure a dashboard-style layout of views for your Perspectives application:

An example application created with Perspectives showing a dashboard layout with drawing, map, tree, and chart views.

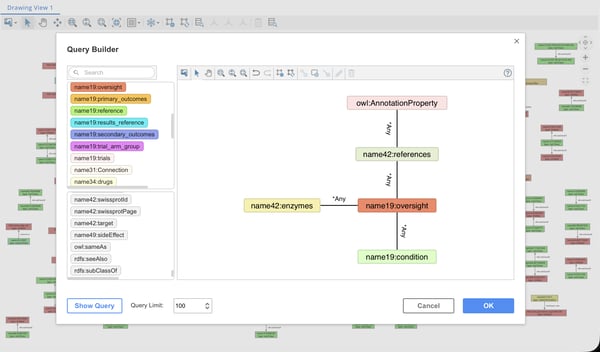
Query triple stores and labeled property graphs alike without the need to know SPARQL, Gremlin, or Cypher.
Eliminate the need to know complex query languages
You may not know every query that users will want to perform, that's why we created the Pattern Matching Query Builder, which greatly simplifies Analysts’ tasks for advanced graph pattern searches without the need to know the SPARQL, Gremlin, or Cypher query languages. The Pattern Matching Query Builder allows users to search for matching patterns in their graphs in triple stores and labeled property graphs alike.
However, if users know Cypher or Gremlin, they can enter their own queries directly. Adding this capability to your Perspectives application is seamless for developers, making data exploration more flexible and developer integration easier.
Improve data navigation and analysis with load neighbors
Load neighbors is an innovative feature in Perspectives that greatly improves the data navigation and analysis experience for end users. Load neighbors enables users to explore their data more effectively, saving them valuable time and allowing them to focus on their most important tasks.
With load neighbors, users can load data incrementally based on their use case by searching for graph patterns through an intuitive graph visualization. As a result, they can gain insights and make faster decisions, which is essential in today’s fast-paced business world.

TECHNOLOGIES
Copyright © 2026 Tom Sawyer Software. All rights reserved. | Terms of Use | Privacy Policy
Copyright © 2026 Tom Sawyer Software.
All rights reserved. | Terms of Use | Privacy Policy
