What is graph layout?
A graph is a set of nodes and edges that connect the nodes to each other. Nodes can represent any object, task, or state while the edges represent the relationships and dependencies between them.
You can imagine that a graph containing any more than a few dozen nodes and edges can quickly become complex to draw clearly, and even more difficult to decipher any meaning from it. This is where graph layout comes in.
Graph layout is the science and art of positioning nodes, connectors, labels, subgraphs, and the routing of edges between them so that the resulting drawings are unambiguous and easy to interpret.
Graph layout has the following optimization criteria:
- keep connected nodes close to each other,
- position objects overlap-free,
- and reduce the number of edge crossings.
Good graph layout allows humans to easily see each element, follow each edge, and extrapolate information that may have been hidden in the data.
An example orthogonal graph layout.
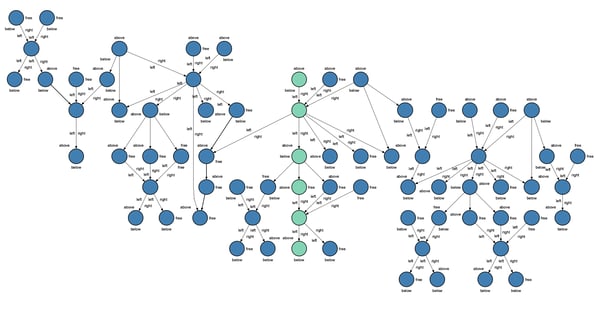
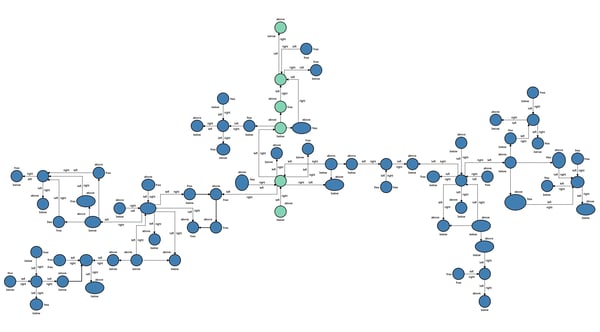
An example symmetric graph layout.
Graph layout reveals the trends and patterns hidden in data.
Who needs graph layout?
Graph layout has application across the private and public sectors, and is used by developers, researchers, IT administrators, scientists, data scientists, and more. Graph layout software helps them analyze complex information and answer important questions.
When applied effectively, graph layout can help you visualize and understand:
- Dependencies
- Networks
- Architectures and models
- Flows and impacts
A simple scenario
The following scenario highlights the benefits of graphs and good graph layout.
Looking at the lists of names below, it would take some minutes to answer questions such as:
- Who is at the top of the reporting chain?
- How many people report to Frank?
Looking at bad graph layout makes answering those questions even more challenging. But with a good graph layout, the answers are immediately apparent.
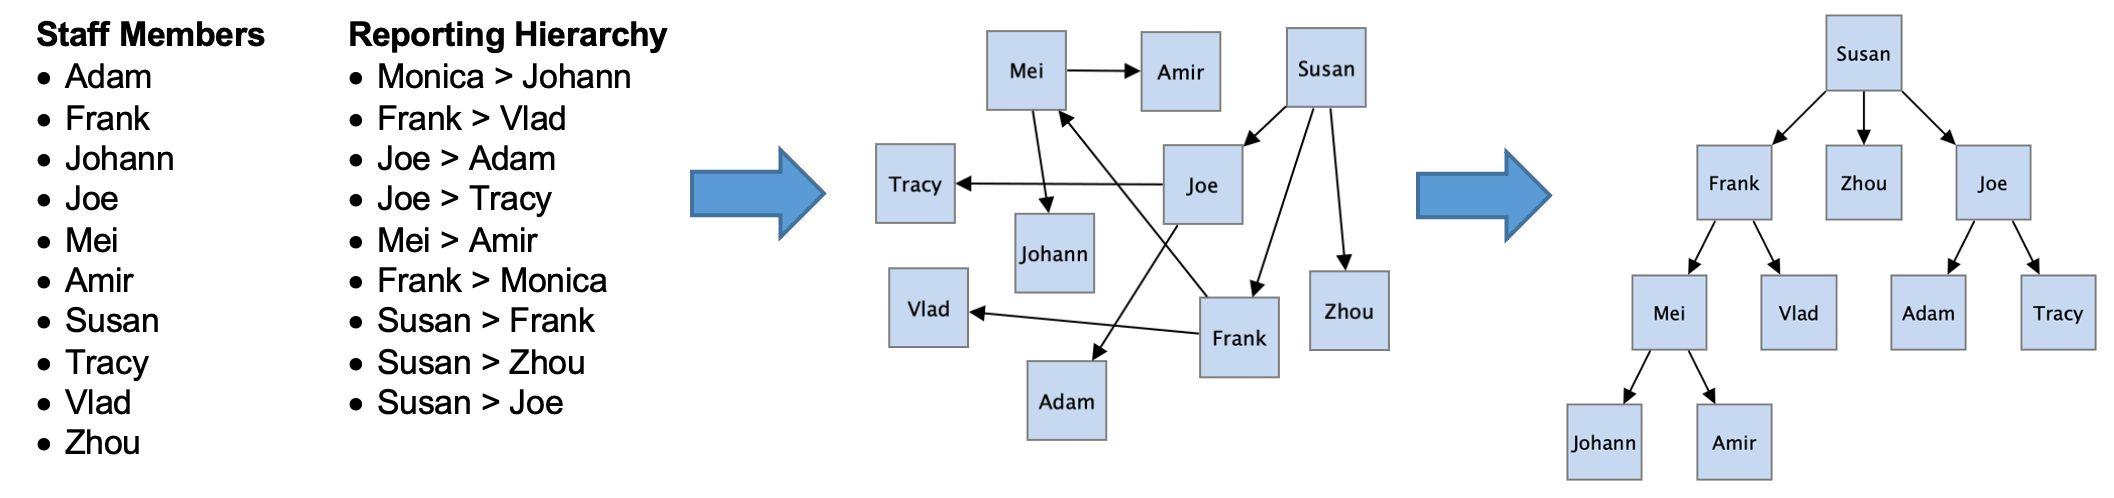
Answering your questions is easier with graphs and good graph layout.
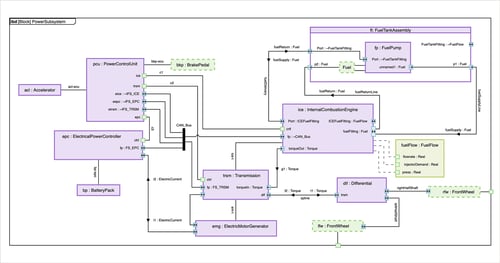
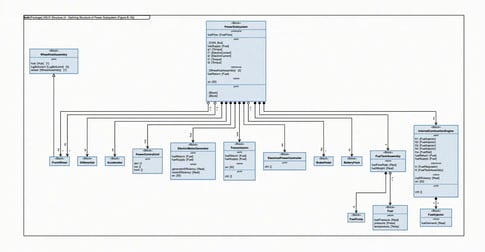
A graph of the power subsystem in an electric hybrid vehicle using the orthogonal graph layout technique.
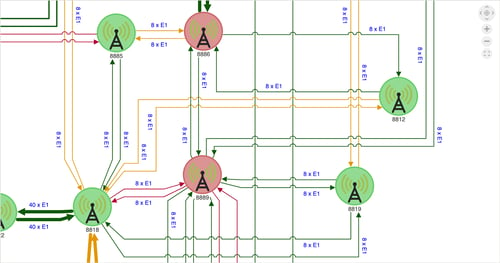
A zoomed-in view of a graph that showcases good edge routing and node and label layout.
Layout techniques and challenges
Graph layout is a complex field of study that has been around for decades. Considerable research on graph layout has been conducted in the United States, Germany, Italy, Latvia, Greece, and Australia with many people receiving Ph.D. degrees in graph layout.
Graph layout problems are more difficult than they may first appear, and in fact many of these problems are in the computationally most difficult category of problems. Therefore, it is necessary to have highly specialized graph layout techniques in order to reliably create high-quality graph visualizations for complex, large graphs.
Researchers in this field have developed a number of graph layout styles and algorithms that are well-known, including spring-embedder, hierarchical, orthogonal and circular layout styles. Open-source and commercial graph layout toolkits using these layout techniques abound. But there are considerable hurdles going from academic research to quality commercial or open-source graph layout systems. Not all techniques and tools are created equally, and many attempts at commercialization have failed.
As with many things, the devil is in the details when you consider the optimization goals mentioned previously, and factor in the number of nodes and edges and any special requirements for the graph. Good graph layout quickly becomes difficult to achieve, and even more challenging to make performant.
Good graph layout should align with user expectations, and provide insight and value not otherwise apparent in the data. It shouldn't be a distraction. And users shouldn't have to wait long to see results.
This is where many tools fail. They distract with messy layouts or worse, hairball-like graphs.
Graphics Specialized for Your Graph Data Application
Perspectives is optimized with high-speed graphics capabilities and HTML5 canvas graphics to create the best in class graph visualizations for your application. You can use Perspectives HTML classes embed the visualization components into your web application and when the HTML class is assigned to any HTML tag, such as <span> or <div>, the tag will be interpreted as a component, regardless of its type.
Tom Sawyer Perspectives provides unrivaled graph drawing and visualization
Tom Sawyer Software has a decades-long track record of innovation when it comes to automatic graph layout and supporting graph use cases. Our CEO Brendan Madden has worked on graph layout since 1985, when he started his career at IBM and built an automatic layout system at IBM Research and another at IBM Santa Teresa Laboratories. Today, our products are the direct result of this long history and experience with graphs.
Tom Sawyer Perspectives is a low-code application development platform that enables software developers to build custom graph visualization and analysis applications to meet their unique graph use cases.
No other commercial or open-source toolkit compares to the graph layout capabilities in Perspectives, which provides:
- automated global and incremental layout of nodes, edges, labels, and connectors
- powerful and flexible edge routing technology
- support for cycles, reflexive edges, and multi-edges
- support for complex nested graph layout
- support for connected components and disconnected nodes
- support of rich graph features including labels and connectors
- a multitude of layout constraints and drawing customization features including swimlanes and control of node positions
A graph with node and edge labels.
A graph with connectors.
Perspectives places the power of layout algorithms into your users' hands
With Perspectives, sophisticated graph layout is put into the hands of the users who need it. Our automated graph layout:
- provides time-saving automated results
- enables users to focus on the important analysis tasks at hand
- provides users with the insight they need
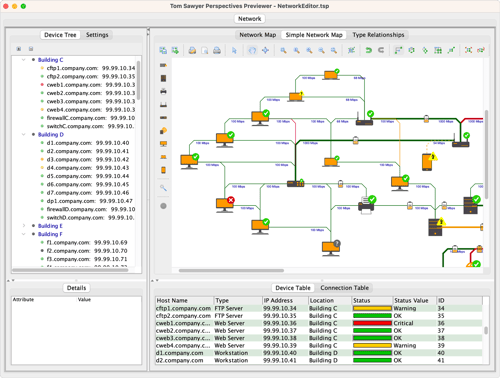
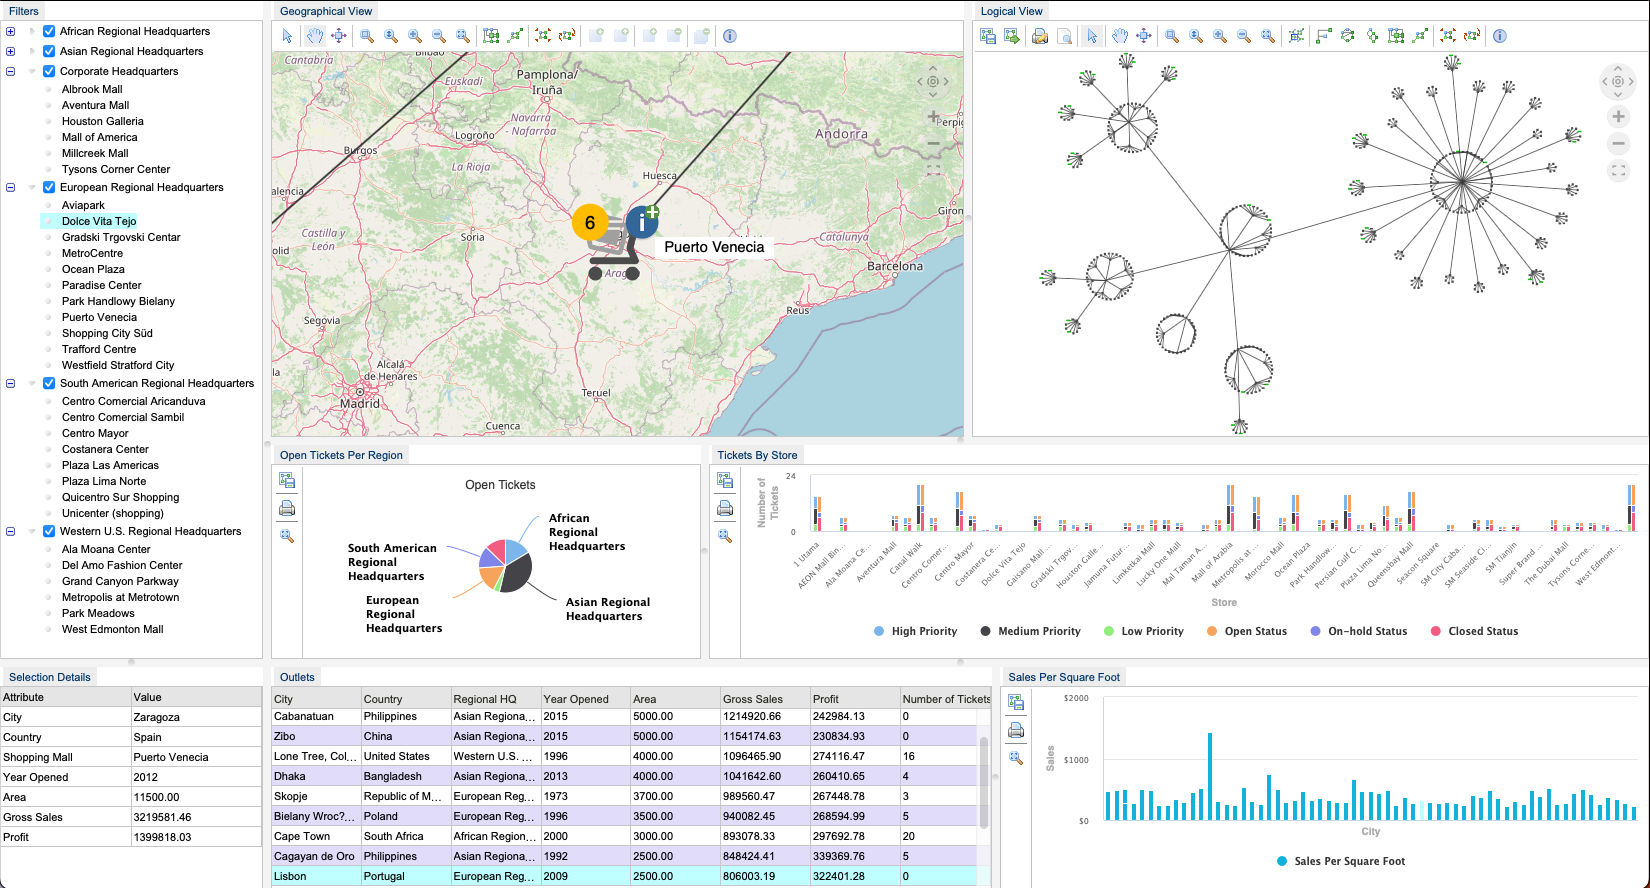
An example application built with Perspectives that showcases integrated graph and data visualization.
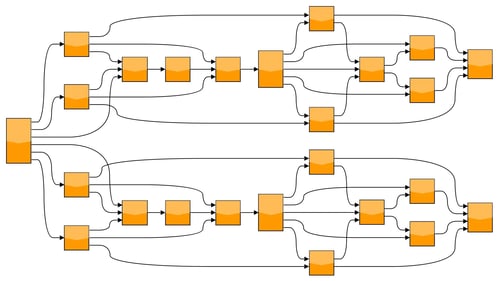
Bundle Layout
This proprietary and patented graph layout style merges, or bundles, the common edges between nodes into one when possible. Instead of seeing five edges leading from five nodes to a common destination, some of those edges bundle together eliminating the hairball effect often seen in large graphs and making the overall graph easier to read. Our bundle layout produces overlap-free drawings and can process several thousand nodes per second.
Bundle layout is best suited to large and dense graphs with many thousands of nodes and edges, but can be equally effective and beautiful in smaller data sets.
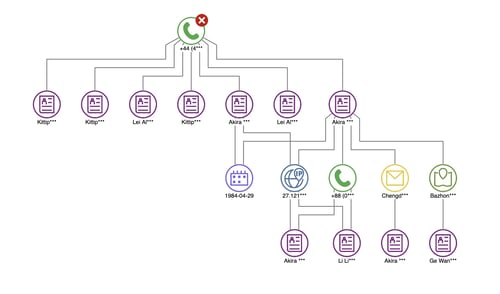
Hierarchical Layout
This graph layout style arranges nodes into layers, either horizontal or vertical, in such a way that most edges go downwards or from left to right from one layer to the next, and then nodes within each layer are rearranged to minimize crossings. Our hierarchical layout also minimizes the overall number of bends in the graph and provides an orthogonal edge routing option, which produces overlap-free drawings.
Hierarchical layout is best suited to use cases where edge direction matters, such as an organizational chart, a flow graph, or a graph of dependencies.
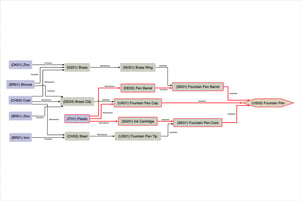
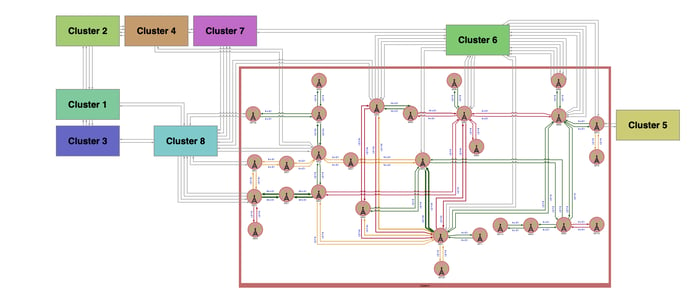
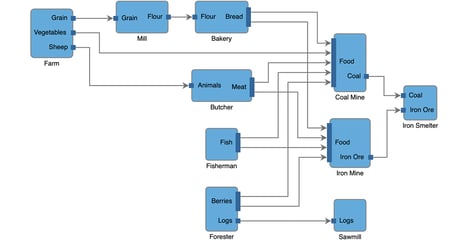
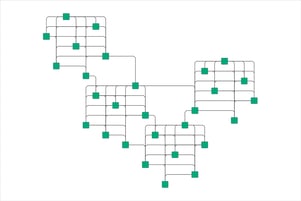
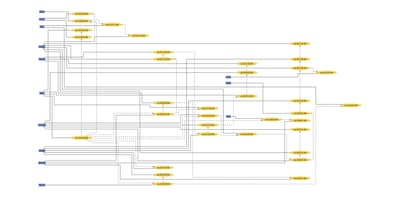
Orthogonal Layout
This graph layout style allows edges to run horizontally and vertically. It achieves this in a multiphase approach to do node placement and then edge routing and labeling considering many rules in the graph. Our orthogonal layout produces overlap-free drawings.
Orthogonal layout is particularly suited to systems models, entity relationship diagrams, and circuit and chip design, but its clean drawings produce attractive results for many other use cases.
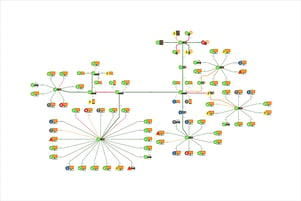
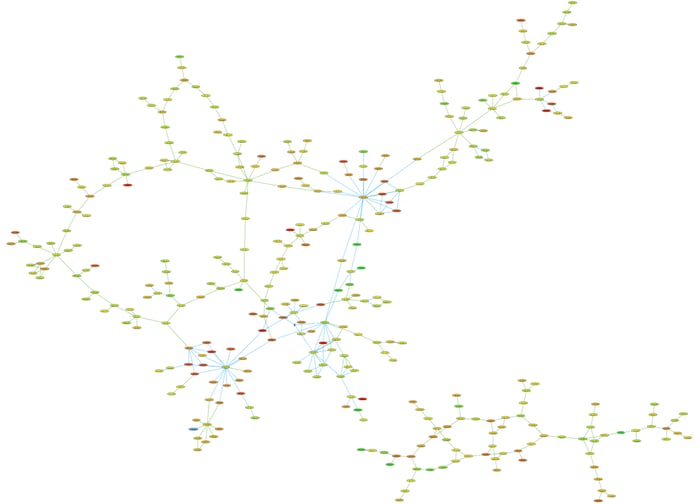
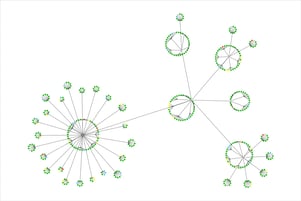
Symmetric Layout
This graph layout style applies attractive and repulsive forces between nodes to achieve a layout in which edge lengths are small while nodes are well-separated. Tom Sawyer Software has refined this well-known technique to reduce the hairball-like effect that can be seen in larger graphs. Many open-source and commercial tools implement this algorithm at its basic level but with much less effective results. Our symmetric layout produces results where nodes do not overlap. It also supports constraints and has special processing that can lay out several thousand nodes per second.
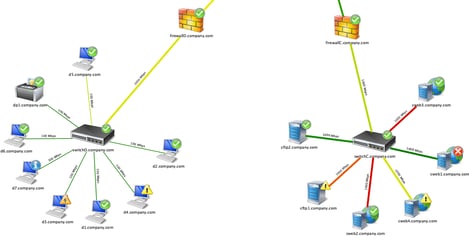
Symmetric layout is useful when you are unsure of the nature of the data, but particularly useful for graphs that represent structures that happen in real life, such as social or computer networks.
Support for global and incremental layout
With Perspectives, users can apply graph layout globally, which calculates positions of all nodes and connectors, routing for the edges, and labeling of the node, edge, and connector labels.
Perspectives also supports incremental layout when it's important for users to maintain their orientation within an existing graph layout. As nodes and edges are added, removed or moved, incremental layout minimizes changes to object positions rearranging only those nodes and edges absolutely necessary to result in a readable graph with a clean layout.
Nested graph layout
Perspectives supports nested graphs and the layout cleanly routes edges between nesting levels.
Graph with expanded node showing nested graph layout capabilities in Perspectives.
Connectors
A connector, or port, is a child object of a node that defines the specific location where edges can attach to nodes. Connectors are useful when precision in the graph drawing is critical. For example, connectors are often used in chip or circuit design where users want to represent the physical locations of pins.
Perspectives provides options to configure the connector shape, size, and color. And Perspectives goes a few steps further, supporting nested connectors where a connector may have other (smaller) connectors, and providing connector constraints where you can choose the node side and a sorted ordering of the connectors along the node side.
The hierarchical and orthogonal layout styles respect the connector constraints when determining node and edge positions. Orthogonal layout integrates connectors even more deeply, allowing end users control over the connector placement and creating enough space in the drawing for them when needed.
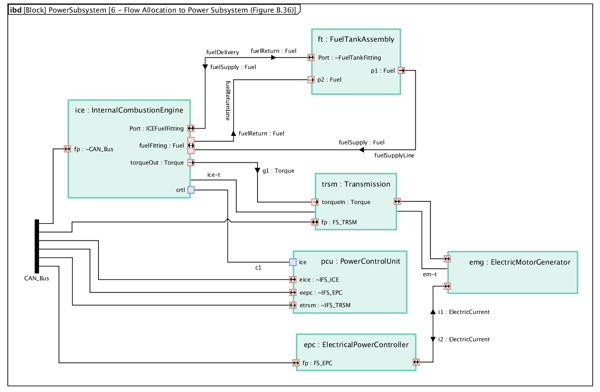
An example Internal Block Definition (IBD) diagram with connectors.
Node and edge labels, and edge decorations
Perspectives provides many options to annotate and enhance your graphs to provide the visual cues your users require. In addition to displaying text inside of a node, you can add labels to nodes and edges and control their placement. You can also add decorations to edges, such as an arrowhead along the edge length.
An example graph with edge labels and decorations.
Layout constraints
Perspectives supports graph layout constraints, which are additional rules that do not apply to the entire graph, but rather to specific graph objects. For example, you may define that certain nodes should be positioned to the left of a different group of nodes. Or you could define that certain edges attach at specific sides of their end nodes.
Whatever your requirements, Perspectives helps you achieve them.
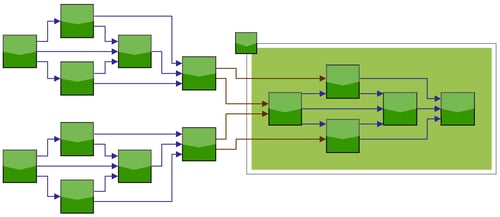
A hierarchical graph layout with vertical alignment constraint (top), and the same graph with orthogonal layout (bottom).
Layout settings
Each layout style included with Perspectives offers many options for fine-tuning layout results. For example, you can choose larger or smaller spacings between objects, you can choose to reduce layout post-processing and generate an initial layout quickly which is especially useful for large graphs, or you can specify more fundamental definitions of the resulting layout, such as whether a Hierarchical layout shows the hierarchy from top to bottom or from left to right.
Hierarchical layout with left-to-right curved orthogonal edge routing.
Support for specialized diagram types
Perspectives supports several special diagram types that are specific to certain industries or use cases.
Swimlane diagrams
Perspectives supports swimlane diagrams, which are especially effective for visualizing process flows. With this layout constraint, the layout algorithm respects the lanes and automatically places elements into their defined lane.
But Perspectives takes it a step further with multi-dimensional swimlanes where horizontal and vertical lanes can be defined and layout places the nodes within the confines of a matrix.
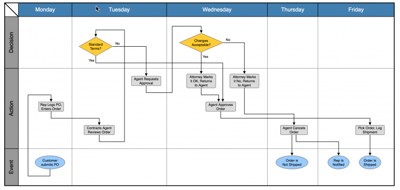
An example multi-dimensional swimlane graph in which process elements are categorized by element type and the day on which it should occur.
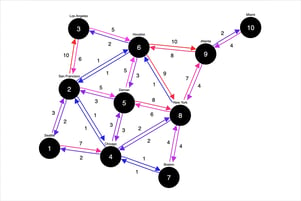
One-line diagrams
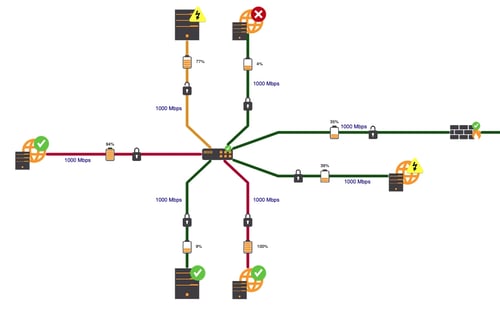
Using a combination of layout constraints and node and edge customization, Perspectives supports one-line diagrams, also referred to as bus-branch model layout.
This style of graph layout is used to depict country electrical grids and is near linear time so it can process very large electrical grids.
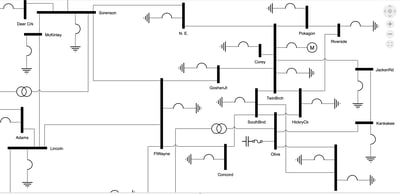
An example one-line diagram.
Timeline diagrams
Perspectives supports timeline diagrams where nodes are aligned horizontally by date and where nodes are aligned vertically from bottom to top in sorted order by time of day.
An example timeline diagram.