Why data analysis and visualization matters
In today’s data-driven world, raw information alone doesn’t drive decisions—insight does. Data analysis and visualization help transform complex datasets into meaningful, actionable knowledge. These practices allow users to detect trends, identify outliers, and reveal relationships that would otherwise remain undiscovered.
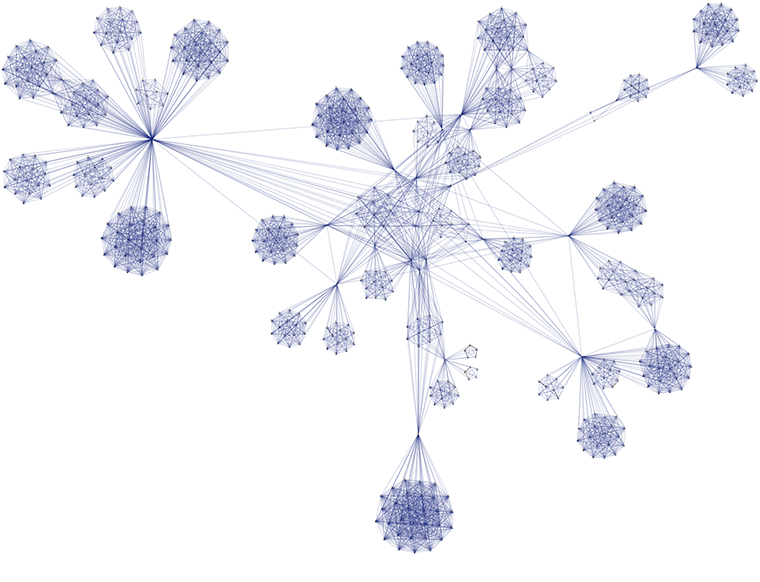
At the core of this transformation are data structures—ways of organizing information for efficient storage and access. Graph models are one such structure, ideal for representing interconnected data. In a graph model, nodes represent entities (like people, devices, or events), and edges represent relationships between them. Unlike traditional tabular models, graphs naturally mirror how real-world systems are connected, enabling more intuitive and powerful data analysis.

Graph-based data analysis and visualization transforms complex data into meaningful, actionable knowledge.
Design

Perspectives low-code point-and-click Designer enables rapid application development.
Preview

Perspectives application Previewer streamlines application development and refinement.

Extract and refine your data model with smart modeling tools
Perspectives flexible schema system makes it easy to define the structure of your data models to support your use case. Whether you're working with relational or graph-based data—or blending both—Perspectives enables you to model entities, relationships, and attributes by automatically extracting your schema and allowing you to customize model attributes and element types.
Choose from basic value types like strings and integers, or more advanced options like references, lists, and computed expressions. You can even define abstract types and use inheritance to organize shared attributes across element types, reducing redundancy and improving clarity.
With the visual schema editor you can view and manually adjust the Perspectives graph schema to match your application needs for ultimate control.

Visualize and refine the structure of your data model with the Perspectives visual schema editor.
Shape your data with rules, filters, and expressions
Shape your raw data into meaningful, business-ready insights using custom rules, filters, and expressions.

Rules transform and derive new values from existing data, such as calculations, string manipulations, aggregations (e.g., sum, average), or date/time conversions. These functions help create calculated fields or metrics that add analytical value beyond the raw data.

Filters limit the data included in models based on specific criteria such as restricting data to a certain time range, region, product category, or user segment. Filters ensure that only the most relevant data is included for a particular analysis or use case and improve performance by reducing data volume.

Expressions combine fields, operators, and functions to define custom logic that is often used to build computed columns, define conditional logic (e.g., case statements), or support dynamic data transformations. Expressions bring flexibility to your models by enabling complex business logic to be embedded directly into the data layer.


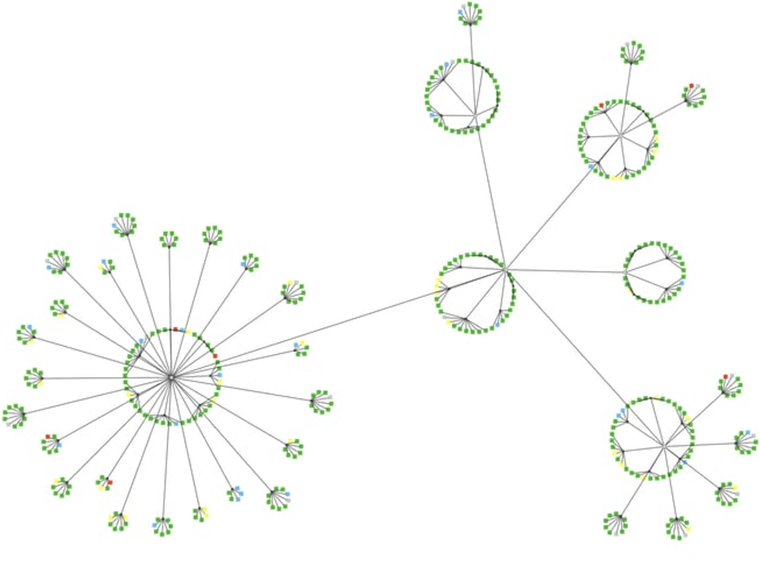
Circular
Graphs often contain subgraphs of nodes that are more strongly related to each other. Circular layout finds these subgraphs, or clusters, and emphasizes them in the drawing while highlighting the superstructure and detail of the overall graph.
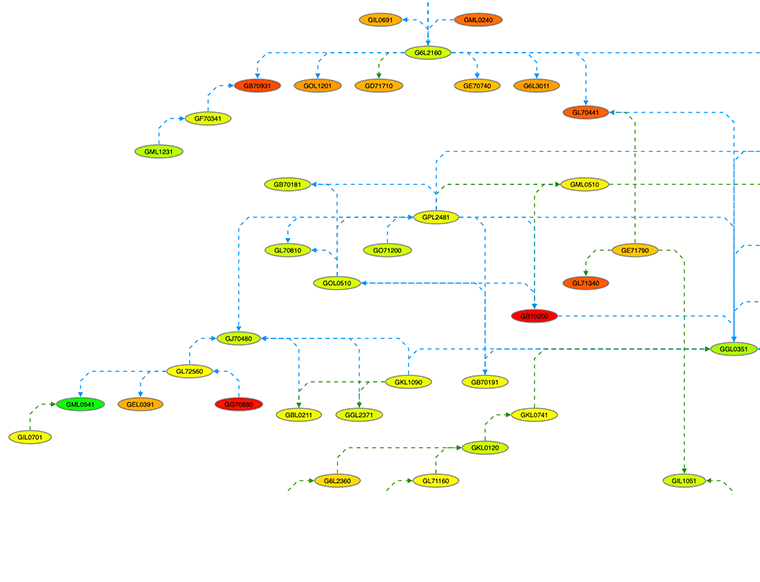
Hierarchical
Hierarchical layout emphasizes dependency relationships and flows. Especially useful for graphs with directed edges, these drawings show that some graph elements depend on others, while other elements do not.
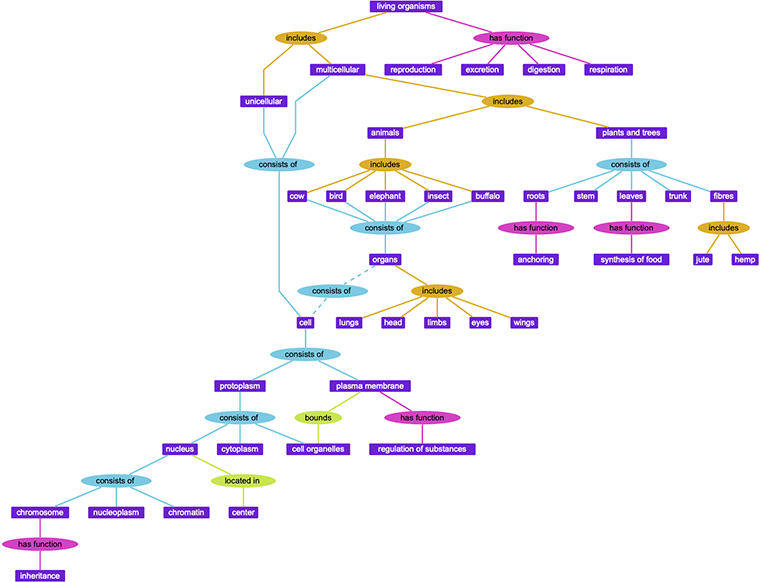
Orthogonal
Edges in Orthogonal layout style are routed with mostly horizontal and vertical segments. This layout produces high-precision visualizations of complex graphs that have many edges, nested components, or specific connection points on nodes.
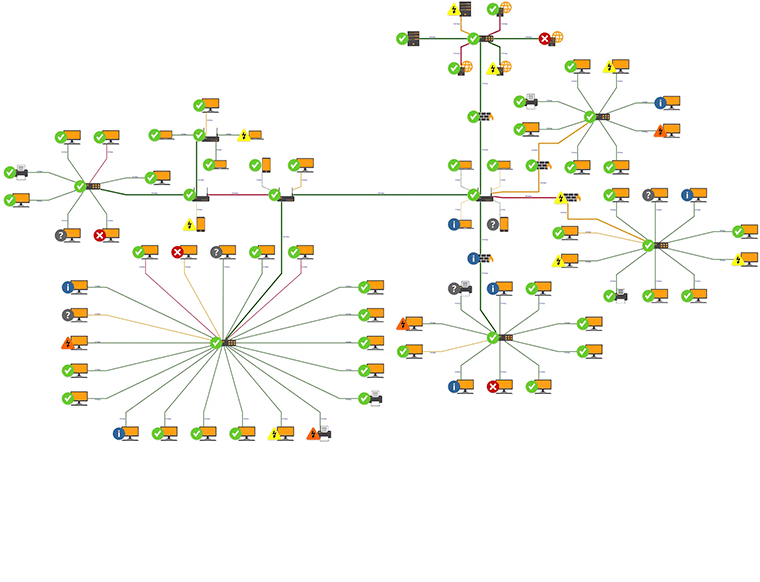
Symmetric
Symmetric layout emphasizes connected nodes by placing them close to each other and drawing edges with straight lines. This layout is particularly useful for graphs that represent structures that happen in real life such as social or computer networks.
Our symmetric layout goes beyond the basic spring-embedder technique, producing overlap-free diagrams that are easier to read.
Flexible and performant graph visualization
Perspectives extensive graph visualization customization features and its advanced rendering framework provide flexibility in how nodes and edges are represented while ensuring high performance when rendered in your graph application.
Perspectives provides advanced node and edge styling, dynamic layouts, zoom-dependent detail, and tools like the magnifier and overview window, for intuitive graph exploration. Custom visuals, animations, and data-driven styling highlight key patterns, delivering powerful graph visualization capabilities that help users understand and navigate complex data.

Data-driven node and edge styling help users understand and navigate complex data.
Code-free data exploration tools
Perspectives is not only a developer-friendly platform, it includes intuitive, code-free exploration tools that make it easy for end users to navigate and understand data.
Easily incorporate attribute-based search, visual pattern matching queries, synchronized highlighting, and seamless link navigation into your application helping users traverse even the most complex graphs—without knowing query languages.

Find specific elements in a dataset by filtering based on defined properties or metadata, making it easier to locate relevant information within complex data structures.

Quickly uncover insights and effortlessly explore data using an intuitive graph visualization—all without the need to know SPARQL, Gremlin, or Cypher query languages.

Automatically translate natural language into Cypher and Gremlin queries, making complex knowledge graph exploration accessible to everyone.

Stay oriented within the data with synchronized data visualization views. Click any element in any view, and the equivalent element is highlighted in other views.

Large data sets and dense graphs are no match for the link navigation tool which easily navigates a link from source to target node in graph drawing views.

Navigate and explore large or detailed visualizations by shifting the view and adjusting the level of magnification, for better focus and context within complex datasets.
Graph data analysis for smarter decision-making
Perspectives includes powerful enterprise data analysis algorithms that add intelligence to your applications and help uncover critical insights from connected data.
Algorithms include shortest path, centrality, connectivity, and clustering that can reveal key influencers, hidden patterns, and optimal paths—enabling more informed, data-driven decisions. Learn more.

Perspectives analysis algorithms reveal insights that enable informed decisions.
Build anywhere. Deploy anywhere.
Perspectives supports both web- and desktop-based applications giving you the flexibility to build and deploy powerful data analysis and visualization applications in the environments that suit your infrastructure and workflow best.
Build with the tools you know
Create applications for both web and desktop platforms using modern technologies:
-
Web: Build responsive web applications using React, Angular, or any standard HTML5 and JavaScript framework.
-
Desktop: Develop robust, interactive desktop applications with Java Swing or .NET.
See the full list of supported features by Perspectives edition:
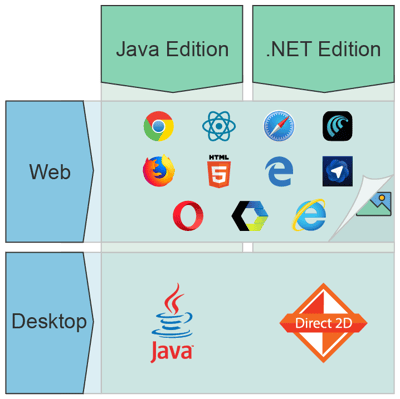
Build desktop or web applications with Perspectives using the tools you know.


Use your existing DevOps pipeline
Whether developing a standalone application or embedding into your current application, Perspectives seamlessly integrates with standard source control, build, and CI/CD integration programs.
Select the deployment option that meets the needs of your end users to enable continuous integration and delivery.

Perspectives flexible platform seamlessly integrates into your CI/CD pipeline.
Deploy and host on your terms
When you're ready to host your finished Perspectives application, choose from a range of secure and scalable hosting options to match your deployment needs.


Internal Server
Want to keep your application behind closed doors? Perspectives can be deployed to your own internal server.

Siloed Server
If your cybersecurity is tighter than tight, you can deploy your graph visualization application to a bunkered, air-gapped server.
Some of the reasons why our customers love us
Tom Sawyer Perspectives is a very well architected product and provides incredible value as a low code solution for visualization of graph data...we could complete the visual in 1/4 of the time.
Vinay Prasad
Vice President, Fidelity
It would have been impossible to develop the sophisticated visualizations without a trusted partner who are laser focused on developing top notch technology and committed for the long haul.

Steve Dickinson
Co-Founder and CEO, HubScope
See example applications in action
Test drive these example applications built with Perspectives that are designed to showcase the capabilities you can include in your data application. Sign up to analyze data, explore layouts, and see what's possible.


