What is graph visualization?
Graph visualization is a way to visually represent the connections between entities in data. Typically, entities are represented as nodes and the connections between nodes are represented as edges. The resulting picture of these nodes and edges is a graph.
Graphs are everywhere, spanning use cases such as the graph of connections in a computer network, a social network, a fraud ring, steps in a process, or an organizational hierarchy.
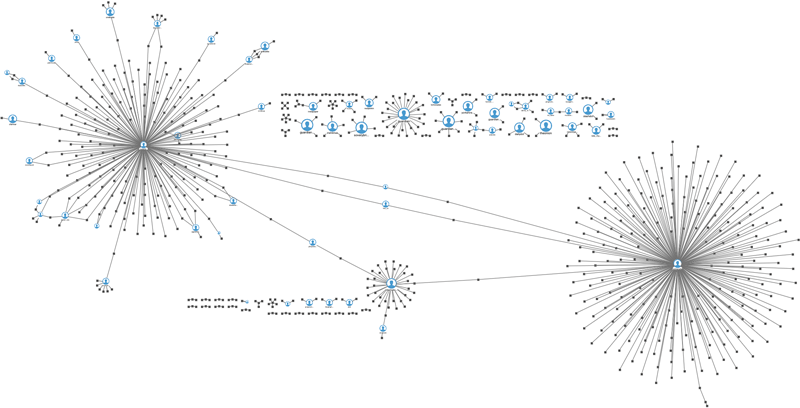
A graph visualization representing a series of tweets.
Effective graph visualization increases understanding.
Accelerate understanding with graph-based techniques
Graph drawings are becoming an increasingly critical component used by enterprises to understand their data. Graphs are everywhere in the natural world and they are easy for people to understand. There are many, well-vetted graph techniques that are excellent for modeling and problem solving.
Today, many industries understand the importance of and are benefitting from graph visualization, including Business Intelligence, Digital Transformation, Digital Engineering, Manufacturing, Finance, Life Sciences, and Government.
With Perspectives, you can create beautiful visualizations of your graph data
Perspectives advanced node and edge user interfaces (UIs) enable you to easily define a distinctive graphical appearance and interactive behavior for graph elements that resonate with the end users of your graph application.
Perspectives provides the following UI customization features:
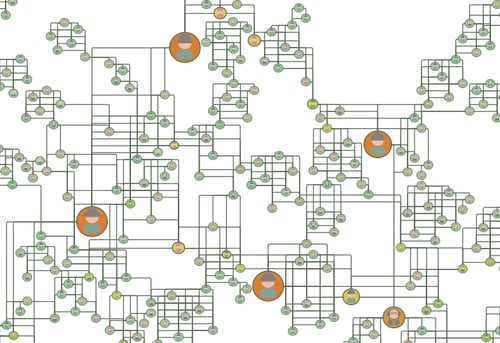
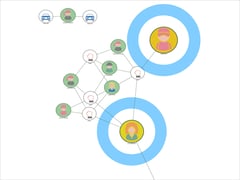
A swimlane graph of a potential fraud ring.
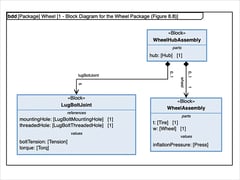
Choose from pre-configured node and edge UIs
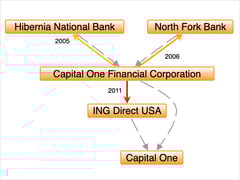
Many out-of-the-box node and edge UIs are provided with the Perspectives Designer. Choose from Activity Diagram, Class Diagram, Network, Organizational Chart, and Basic Shapes for nodes.
Edge types include straight, flowing, curved, dashed, with and without arrows, and more.
Use your own images
Customize edge UIs
Using edge templates, you can customize the style, line thickness, color, add arrows, crossing style, and more to be as precise as your visualizations demand. When edge direction matters, configure edge UI properties differently for source and target nodes.
Apply different node and edge templates to highlight key entities
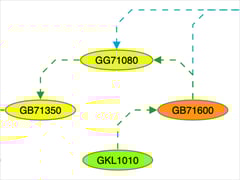
Multiple node and edge templates give you flexibility to apply different UI templates in different situations. Node UIs can show status, properties, or adjust size or color from the data or as a result of graph analysis to draw the users attention to and highlight key results.
Customize node and edge colors
Customize font and font size
Supercharge your graphs with data-driven graphics
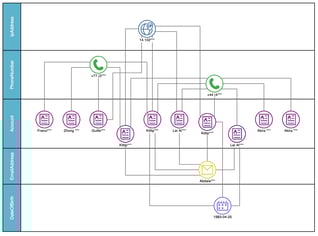
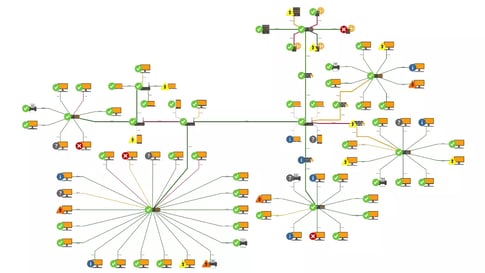
When dealing with dynamic data, it's essential to provide visual clues to users that highlight important aspects of the graph elements. For example, you may want to highlight capacity or load, as seen in this microwave network example.
You can define node and edge UI element properties that are evaluated when a UI is displayed. Using expressions that consist of functions, the UI can be rendered differently based on drawing element properties and attributes.
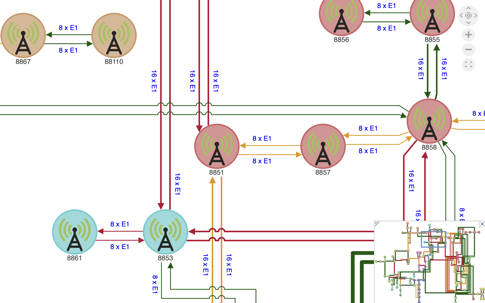
In this example, nodes are colored by location, edges are colored by load, and edge thickness reveals capacity so users see trouble spots at a glance.
Configure UIs with different levels of detail
Seeing the super structure of the graph is important, but you don't want it cluttered with unreadable information.
Perspectives supports level of detail UIs so you can show more or less information as users zoom in to or out of the graph drawing.
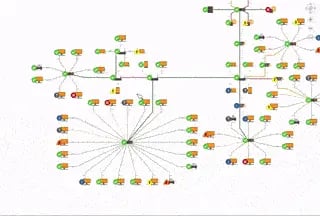
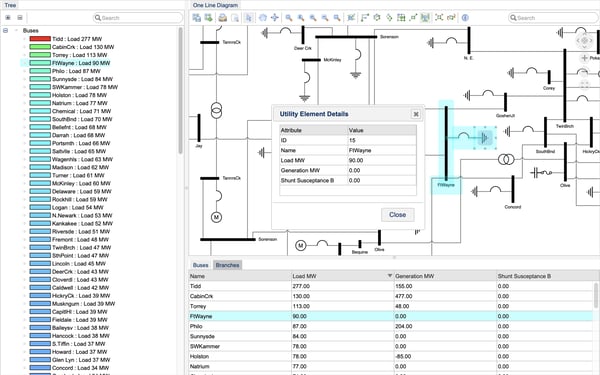
Zooming in and out shows more or less details for nodes in this graph.
Explore data in more detail with the magnifier tool
Available for both drawing views and map views, the magnifier tool allows users to delve deeper into their graph visualizations by providing an interactive zoom function. Accessed through the magnifier toolbar item or as part of the Select tool, users then hold the Spacebar enabling them to interactively explore the finer details of their graphs.
Learn more by watching our easy how-to video on using the magnifier tool.

The magnifier tool zooms into a portion of the drawing for closer inspection.
Navigate and maintain your bearings in large graphs with the Overview window

Navigate your graph drawing and zoom in and out with the overview window.
Enhance graph drawings with visual cues
Sometimes it's the small details that can make a big difference to your end users. Perspectives provides a comprehensive set of options that add additional value to your graph visualizations, including:
- HTML-formatted tooltips
- Selection highlighting
- Hit-testing
- Hover effects
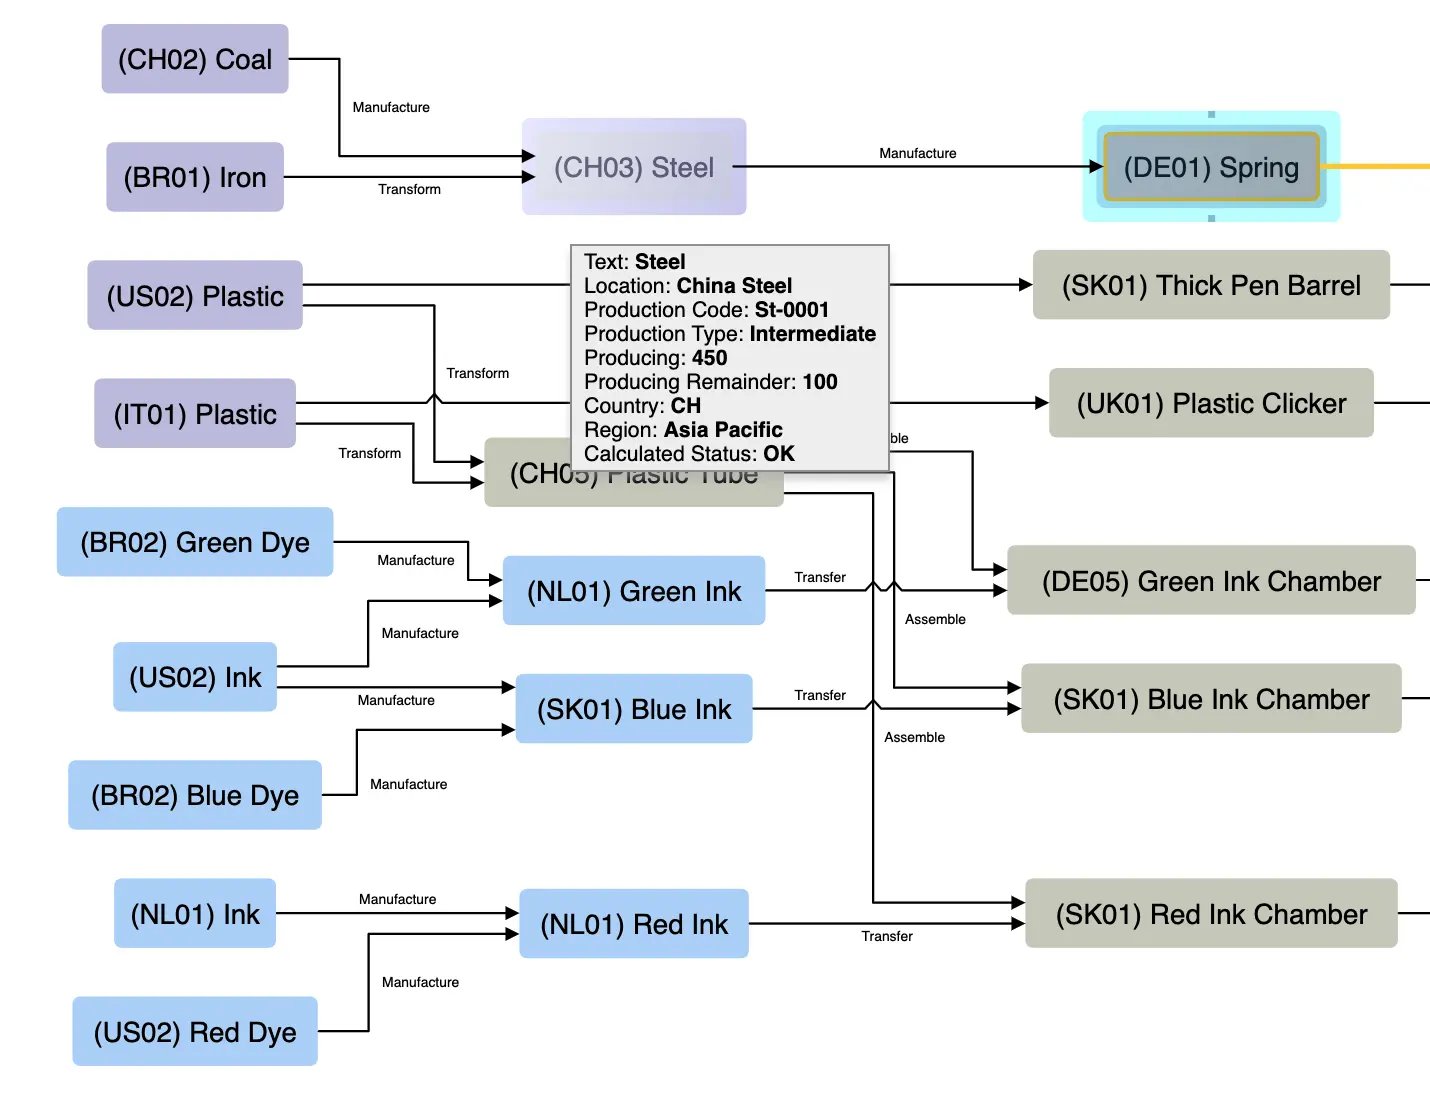
A graph showing a selected node, a highlighted node, and a tooltip.

Customizable toolbar options
Each application built with Perspectives can have multiple toolbars that are fully configurable and are tailored for the context in which they are used.
And, mnemonics and shortcuts can be defined to activate toolbar items.
![]()
![]()
Graph animations
Make your application interactive with dialogs, context menus, and invokable views
Perspectives includes customizable dialogs for several types of user interactions:
- Showing information
- Asking the user for confirmation
- Asking the user for input
You can also create a customizable, invokable dialog which can contain a drawing, inspector, table, tree, timeline, map, or chart view.
A context menu consists of a hierarchy of menu items that can be invoked with the selection of a node or edge, and you can choose from the prebuilt menu items that come with Perspectives, or you can use Perspectives APIs to add your own menu items.
An example application built with Perspectives showing an invokable view dialog.
Integrating graph visualization into your application
Perspectives supports both web- and desktop-based applications giving you the flexibility to build and deploy powerful data analysis and visualization applications in the environments that suit your infrastructure and workflow best.
Perspectives modern web client framework makes it easier for developers to integrate and build modern applications in React, Angular, and HTML.
Perspectives React APIs offer seamless integration into React applications with the application generation tool that automatically creates template source code, folder structure, and build scripts from your project definition.
Additionally, Perspectives Web Components encapsulates view components as extended and customizable HTML tags providing developers the freedom to build Perspectives applications using the web framework of their choice.
Perspectives desktop libraries provide the building blocks for developers to easily create applications in Java Swing and .NET.

Advanced customization options

Advanced JavaScript resources
For even more configurability, Perspectives supports JavaScript functions to invoke commands in your web application, such as Layout, ActivateTool, RunAnalyzer, OpenHtmlDialog, and many more.
JavaScript callback functions are supported, and you can use JavaScript functions when developing a web application in pure HTML or JavaScript, or when using Dojo, JQuery, Ext-JS, or another JavaScript framework to host Perspectives data visualizations.
In addition, React-based APIs support customers in either JavaScript or TypeScript environments.
You can find additional details in the documentation.

Cascading Style Sheets (CSS)
When incorporating visualization into your existing application, you can use CSS to style your visualization components.
Inherit from your application CSS to adjust content size, spacing, color, and font or add decorative features, such as animations or split content into columns.