What are graph drawings?
Real-world graphs are large and complex, sometimes with many thousands of nodes and edges. Data ops managers, analysts and others who work with large volumes of data can be easily overwhelmed and struggle to understand where to begin and how to pinpoint the important areas of the graph. They need advanced visualization and navigation capabilities to not only orient themselves and make sense of their connected data but to gain actionable intelligence from the data. This is where graph drawings come in.
Graph drawings are the application of techniques for interacting with, navigating and managing complex graph data.
Graph drawings can help you to:
- Make sense of complex data
- Navigate, interact with, and update your data
- Focus on the key areas of the data
- Effectively communicate critical results to stakeholders and decision makers
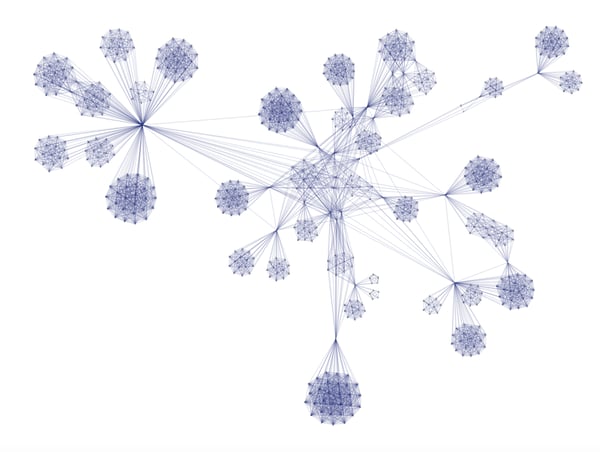
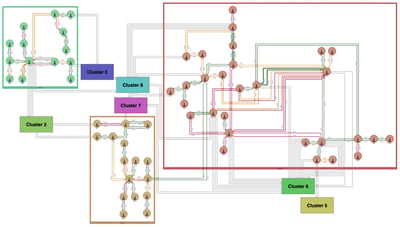
Large symmetric graph.
How do graph drawings solve big data challenges?
When applied successfully, graph drawing techniques can reduce the pain points of dealing with large graphs. These techniques include advanced customization and navigation so that you have the right visualizations and user interaction to get the most out of your data.
When graph drawing application techniques are applied effectively, they can:
- Highlight relevant data in your visualizations
- Reveal the superstructures inherent in your data
- Manage the complexity of the graph
- Clearly convey multiple levels of detail
- Provide a level of precision to the graphs

Common graph drawing techniques include labels, connectors, edge jumpovers, nesting and precise shape clipping.
Nesting is a graph drawings technique that manages complexity by showing and hiding details.
Who can benefit from Perspectives graph drawings application techniques?

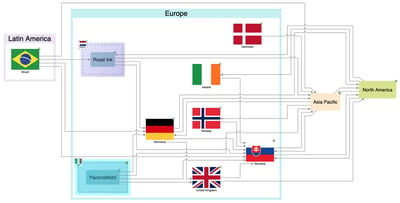
Graph drawings convey the superstructures inherent in your data.
Perspectives graph drawings are especially useful for engineers, managers and analysts that are responsible for designing and managing complex systems.
Graph drawings are critical for industries that have highly complex data and rely on quickly and clearly conveying key results, including:
- Systems Engineering
- Telecommunications
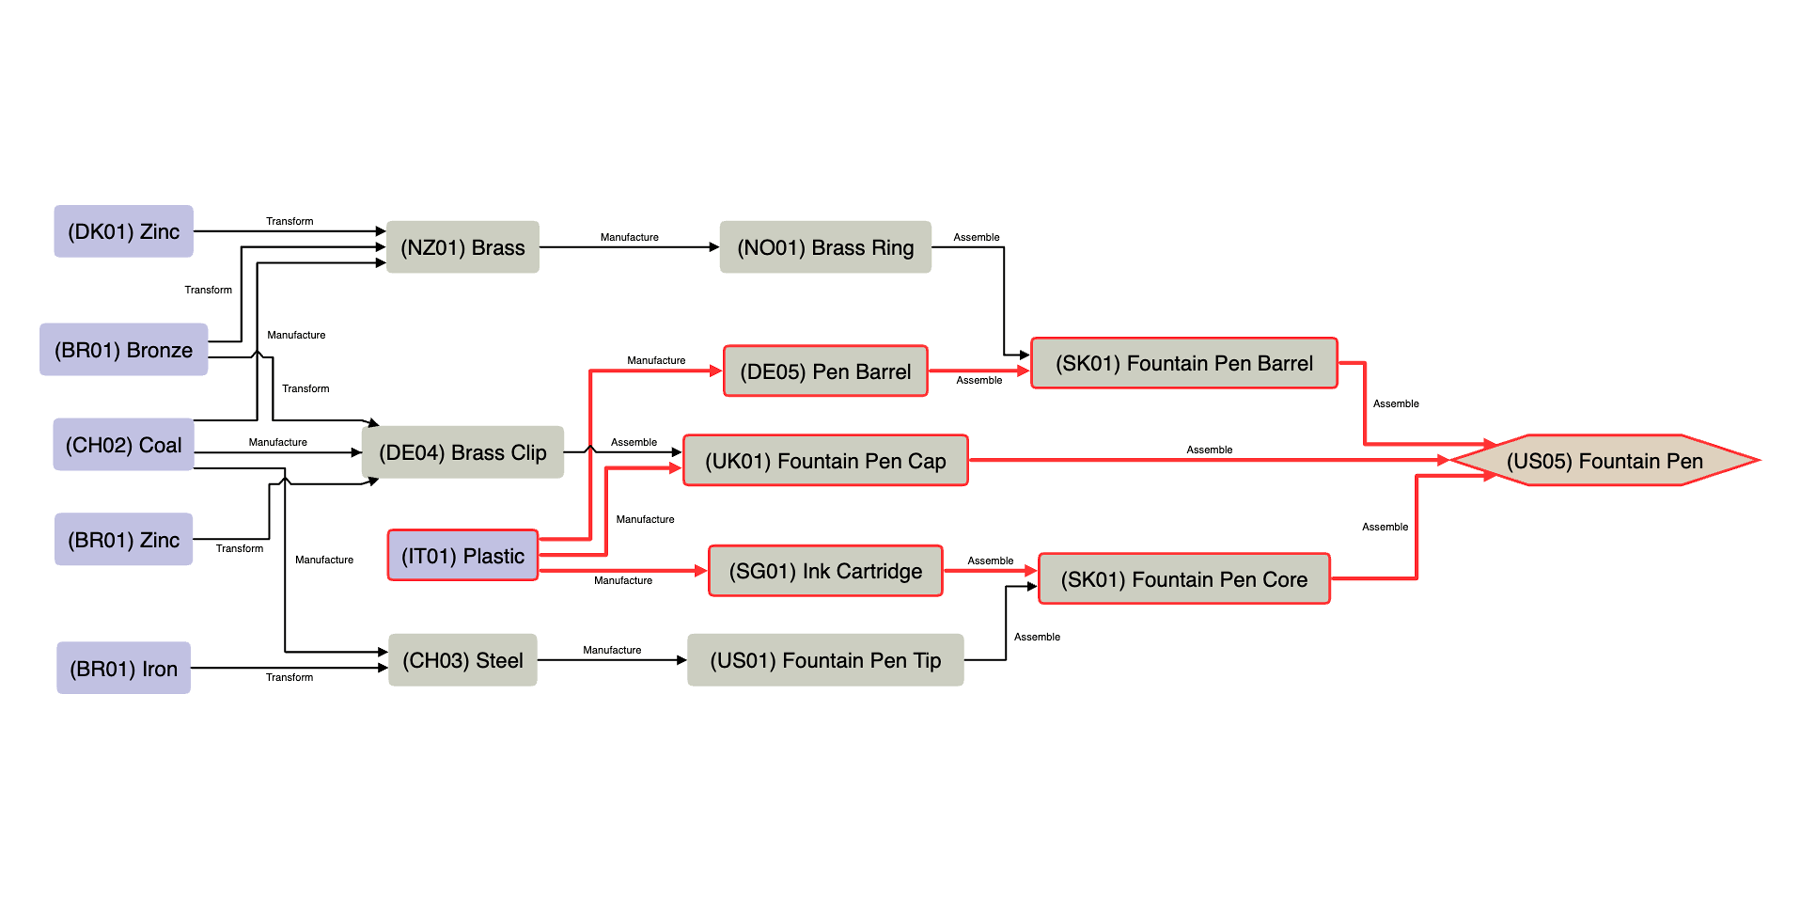
- Manufacturing
- Defense and Intelligence
- Cybersecurity and IT
- Life Sciences
Tom Sawyer Perspectives provides unrivaled support for graph drawings
Tom Sawyer Software brings decades of experience in solving complex data problems for enterprises in a variety of industries.
Perspectives, our low-code application development platform, enables developers to build custom graph visualization and analysis applications to meet their unique graph use cases.
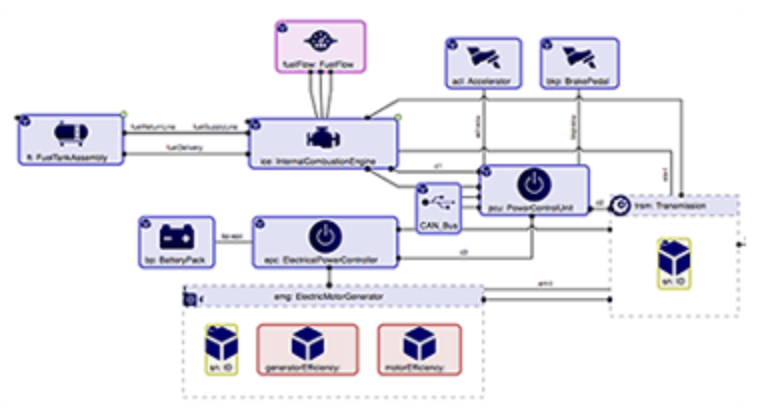
The Perspectives graph platform solves data challenges by providing a powerful geometric, graph-based data model that supports:
- Nodes that have shapes, child graphs and connectors
- Edges that have routes
- Connectors that have shapes and can be variable size
- Nodes, edges and connectors that have labels
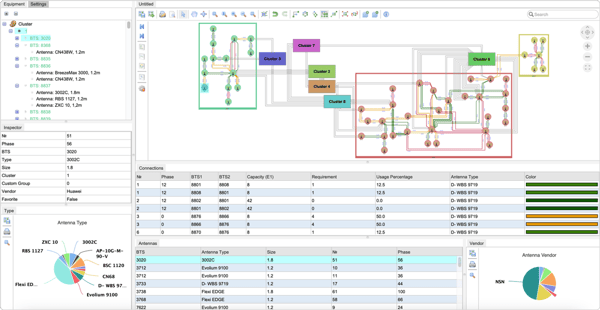
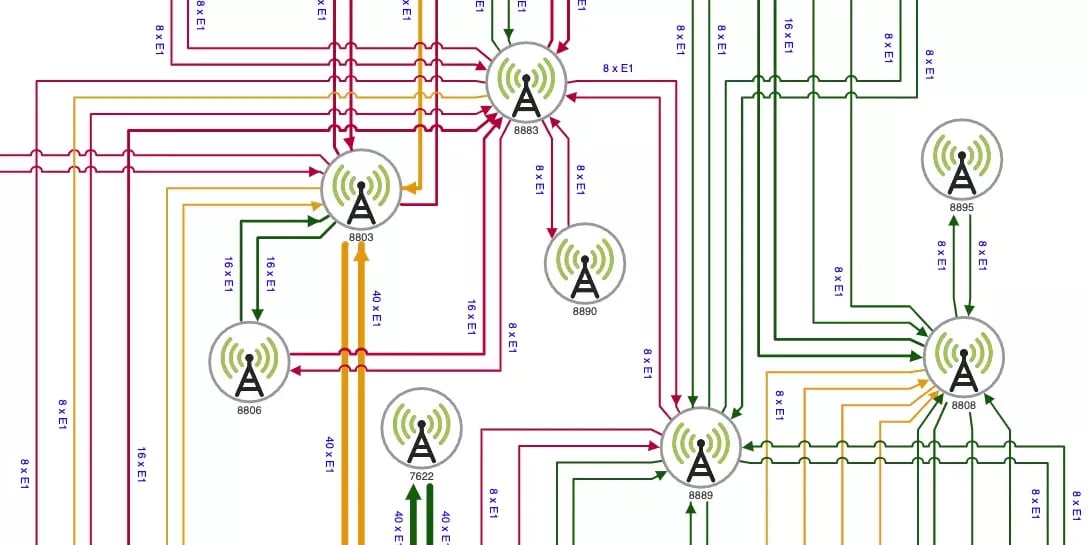
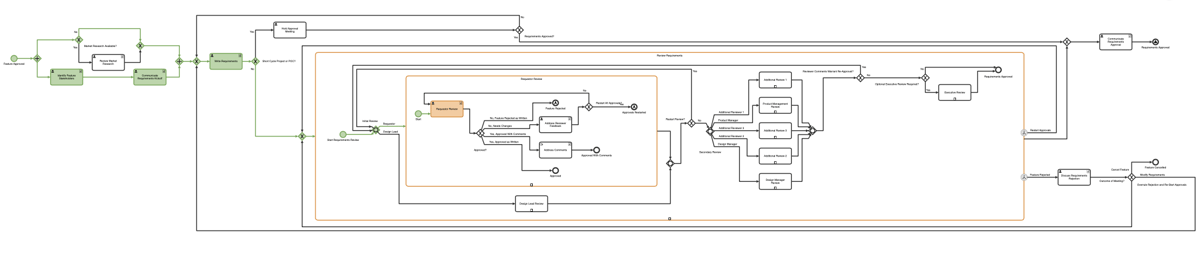
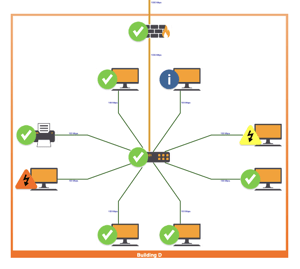
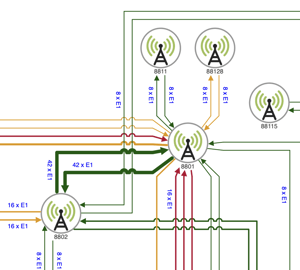
An example telecommunications network application built with Perspectives.
Powerful drawing tools at your fingertips
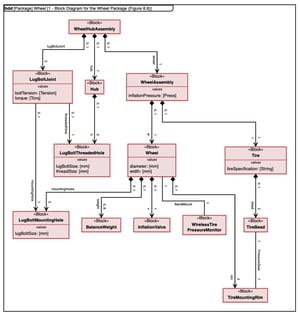
Nested Drawings
Nesting a graph inside of another element helps manage complexity in your data to reveal the superstructure. Perspectives supports nested drawings in nodes or edges. Determination of which elements to place in a nested drawing can be a result of data integration, graph analysis or user interaction. Perspectives supports nesting to any number of levels for complex graphs.
Meta-Edges
When an edge connects a node in a child drawing to a node in another drawing, it is called an interdrawing edge. When the parent node that contains the child drawing is collapsed, one end node of the interdrawing edge is no longer visible. Perspectives replaces this interdrawing edge with a meta-edge to visually indicate that there is a relationship between the nodes in the two drawings until the parent node is again expanded.
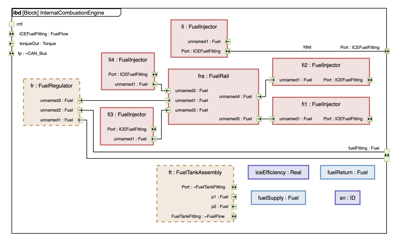
Connectors and Nested Connectors
Perspectives supports connectors, which are elements often associated with a node and to which edges can attach. Connectors are typically rendered with a rectangle or a polygon. Any number of edges can attach to a connector and the connector will grow in size, as needed, to accommodate all of the edges. Perspectives also supports connectors nested inside other connectors.
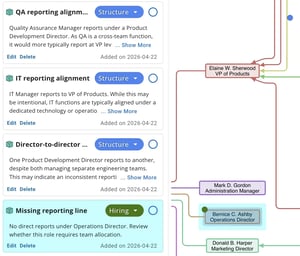
Annotations
Perspectives provides an annotation framework for adding rich, contextual notes directly to nodes and edges in graphs. Annotations can be categorized, color-coded, and filtered, allowing end users to organize insights and focus on what matters most. Annotations appear as colorful badges in the drawing, making it easy to identify flagged items, issues, or key observations at a glance.
Labels
Perspectives supports labels that annotate nodes, edges, connectors and edge decorations. Multiple labels per element are supported. Our labeling technology ensures that edge labels do not overlap nodes, edges, or other labels, and that they do not overlap crossing locations in bundle layout, orthogonal layout, or hierarchical layout with orthogonal edge routing.
Precise Shape Clipping
Perspectives supports precise shape clipping so that nodes can have complex shapes yet make it clear which edges are connected to which nodes. Tom Sawyer Software has a US patent for this technology.
Edge Decorations
Perspectives supports edge decorations, which are view elements that convey additional information about an edge. Edge decorations are represented by a symbol, such as an arrowhead or an image.

Jumpovers
Perspectives supports jumpovers, which are techniques to visualize edge crossings in a graph visualization. Jumpovers allow users to easily follow edges as they cross over other edges.
Try these hands-on demos
Built using Perspectives, these demos highlight the power of graph drawings and allow you to experience graph interaction firsthand. Sign up and explore.
For even more example applications, see the Graph Application Examples page.