Knowledge Graphs

Build, maintain, and explore knowledge graphs that connect enterprise data and support more informed decisions.

What are knowledge graphs?

Knowledge graphs connect real-world entities, such as people, places, events, and concepts, and maps out how they relate to one another. Knowledge graphs use nodes to represent entities, where each node stands for a unique entity, and edges to represent the connections or relationships between these entities. These relationships can be diverse, such as "works for," "located in," or "similar to." The resulting entities and relationships are then structured in a graph format.

Like our brains, knowledge graphs meaningfully link related physical or logical concepts helping us understand how data is related, and enabling us to connect information across sources to reveal relationships, uncover patterns, and support more informed decisions.
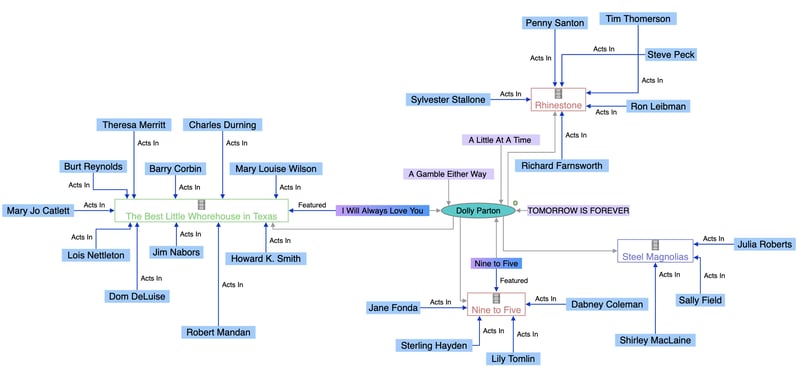
A knowledge graph with actors, movies, songs and artists (nodes) and their relationships (edges)

A knowledge graph with actors, movies, songs and artists (nodes) and their relationships (edges).

What makes knowledge graphs so powerful?

Making the right connections helps teams uncover opportunities, improve coordination, and make more informed decisions. Consider a business-critical asset, such as a piece of equipment. Its specifications, suppliers, maintenance history, operating costs, and the business processes that depend on it may be documented across different enterprise systems.

Connecting these details gives stakeholders a more complete understanding of the asset, helping them improve its performance, plan investments, and assess the impact of proposed changes.

Knowledge graphs bring this connected perspective to a dynamic business environment, providing a flexible foundation for applications that help teams act on the relationships that matter most.

  • Knowledge graphs describe data and its relationships, making information easier to interpret.

  • Knowledge graphs evolve as new information and relationships are discovered.

  • Knowledge graphs connect information across business silos.
Knowledge graphs represent information in node-edge structure using understandable language that enhances familiarity with users

Familiarity

Knowledge graphs organize information into a node-edge structure that is similar to the connections our brains make when we build up knowledge about the world, unlike relational databases that force data into a rigid tabular form with keys to other tables.

Knowledge graphs can also supply data using the language that users recognize, even if legacy databases have used arcane or out-of-date data labels. 

Knowledge graphs make data and connections more accessible and familiar to people and other systems.

Knowledge graphs make room for any new information when it becomes available

Flexibility

Knowledge graphs grow organically as new information is discovered. Like our brains, knowledge graphs make room for any new information when it becomes available.

Because the knowledge graph is there, further knowledge discovery is possible. New knowledge can be inferred semantically, identified with graph algorithms, or supplied by your enterprise social network.

Knowledge graphs make data accessible to everyone in your organization

Accessibility

Linked data and knowledge graphs provide context for other people and systems in your enterprise to correctly interpret and apply the graph to serve your business.

By overcoming data silos, your enterprise knowledge graph becomes the graph platform for faster business applications development, more informed data science, and more effective decision support.

Knowledge graph systems help find the edge that matters

When information about your critical assets is in different data silos, it can present major challenges for stakeholders to find and connect all the relevant data they need. Consider these scenarios where knowledge graph systems assemble enterprise knowledge and help find the edge that matters.
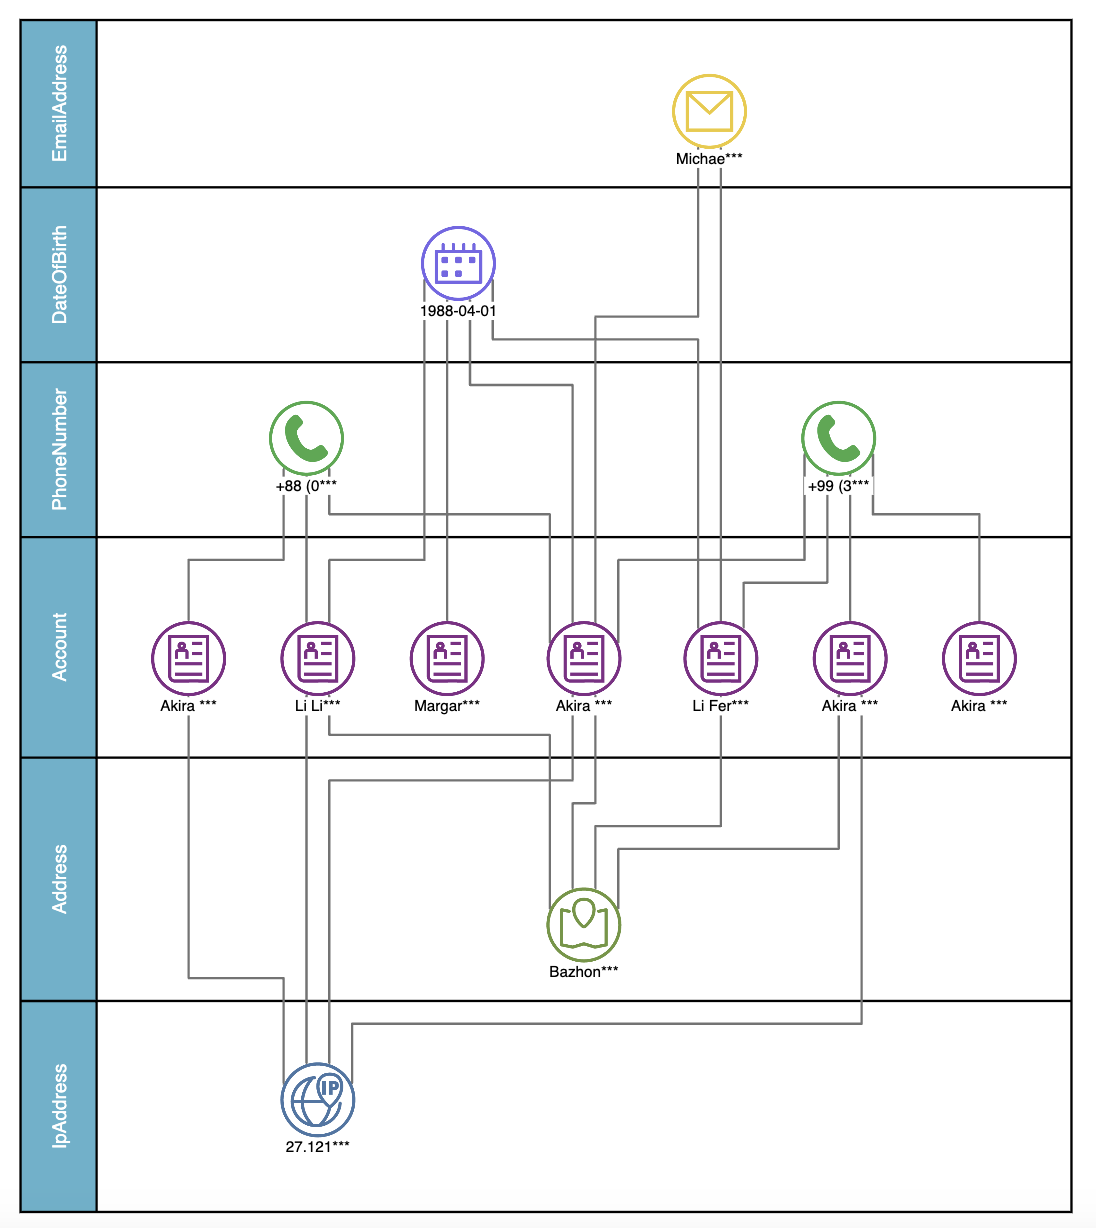
Knowledge graph systems in finance provide deep insights, enhance risk management, improve compliance, and support strategic decision-making

Finance

Knowledge graph systems in finance provide deep insights, enhance risk management, improve compliance, and support strategic decision-making. A knowledge graph can help you make the right connections.

  • A third-party maintains critical assets in your network, but are they really delivering the services you are paying for?

  • Can you better optimize the lifecycle costs of this asset?

  • Can you link the maintenance records with your production records to see if a lack of timely maintenance is causing downtime?
Knowledge graph systems play a crucial role in enhancing operational efficiency, reducing risks, and driving continuous improvement

Operations

Knowledge graph systems play a crucial role in enhancing operational efficiency, reducing risks, and driving continuous improvement.

Did you know that assets have a social network? A knowledge graph can ensure that you have a clear picture of the impact an asset has on your operations and business stakeholders.

  • Is this asset critical to the function of a network of other assets in your facility?

  • Exactly what functions or departments depend upon it?

  • Should you repair or replace this asset to make the network function more effectively?
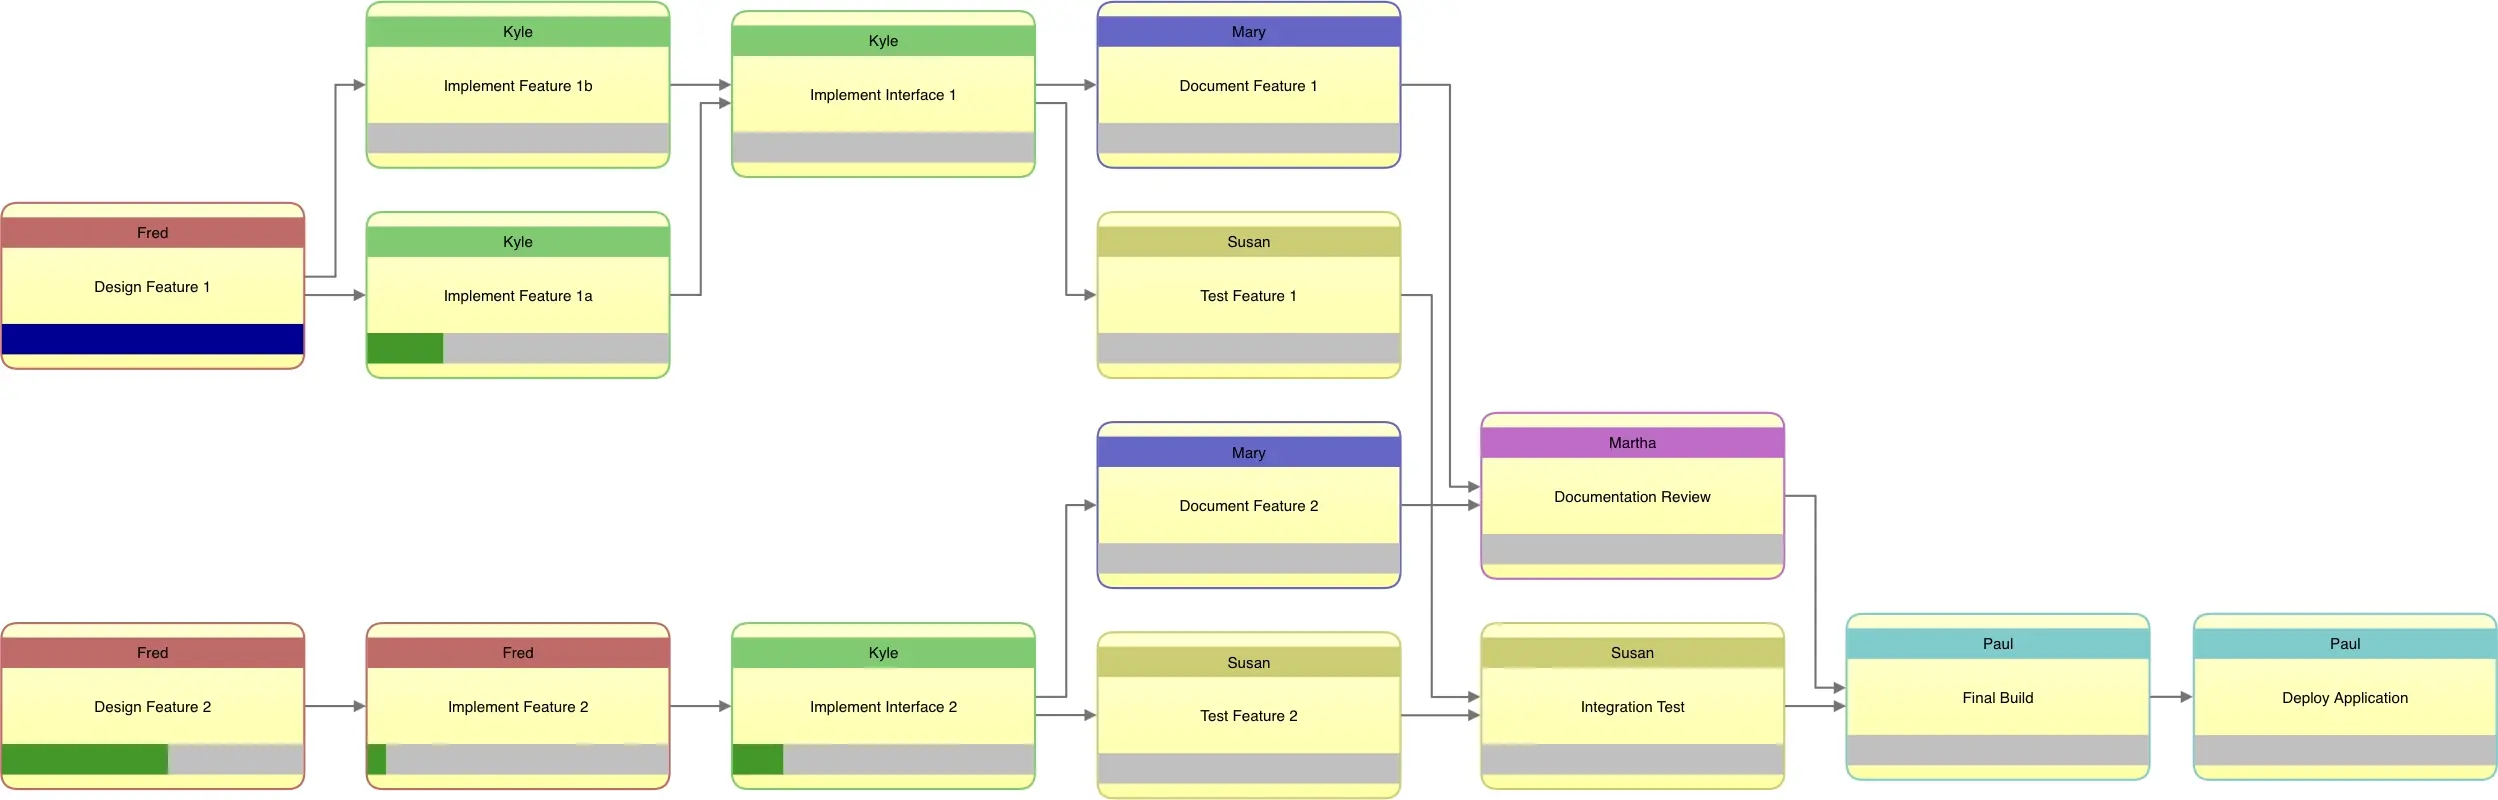
Knowledge graph systems are crucial in plant operations and production floors for optimizing processes, enhancing decision-making, reducing costs, and improving overall efficiency and productivity

Production

Knowledge graph systems are crucial in plant operations and production floors for optimizing processes, enhancing decision-making, reducing costs, and improving overall efficiency and productivity. Knowledge graph systems make answering these questions possible:

  • Can you trace product quality issues back to this asset?

  • Can you associate the maintenance history with the production history?

  • What are the regulations about the operation of this equipment?

  • Are any plant floor injuries related to operating this asset?
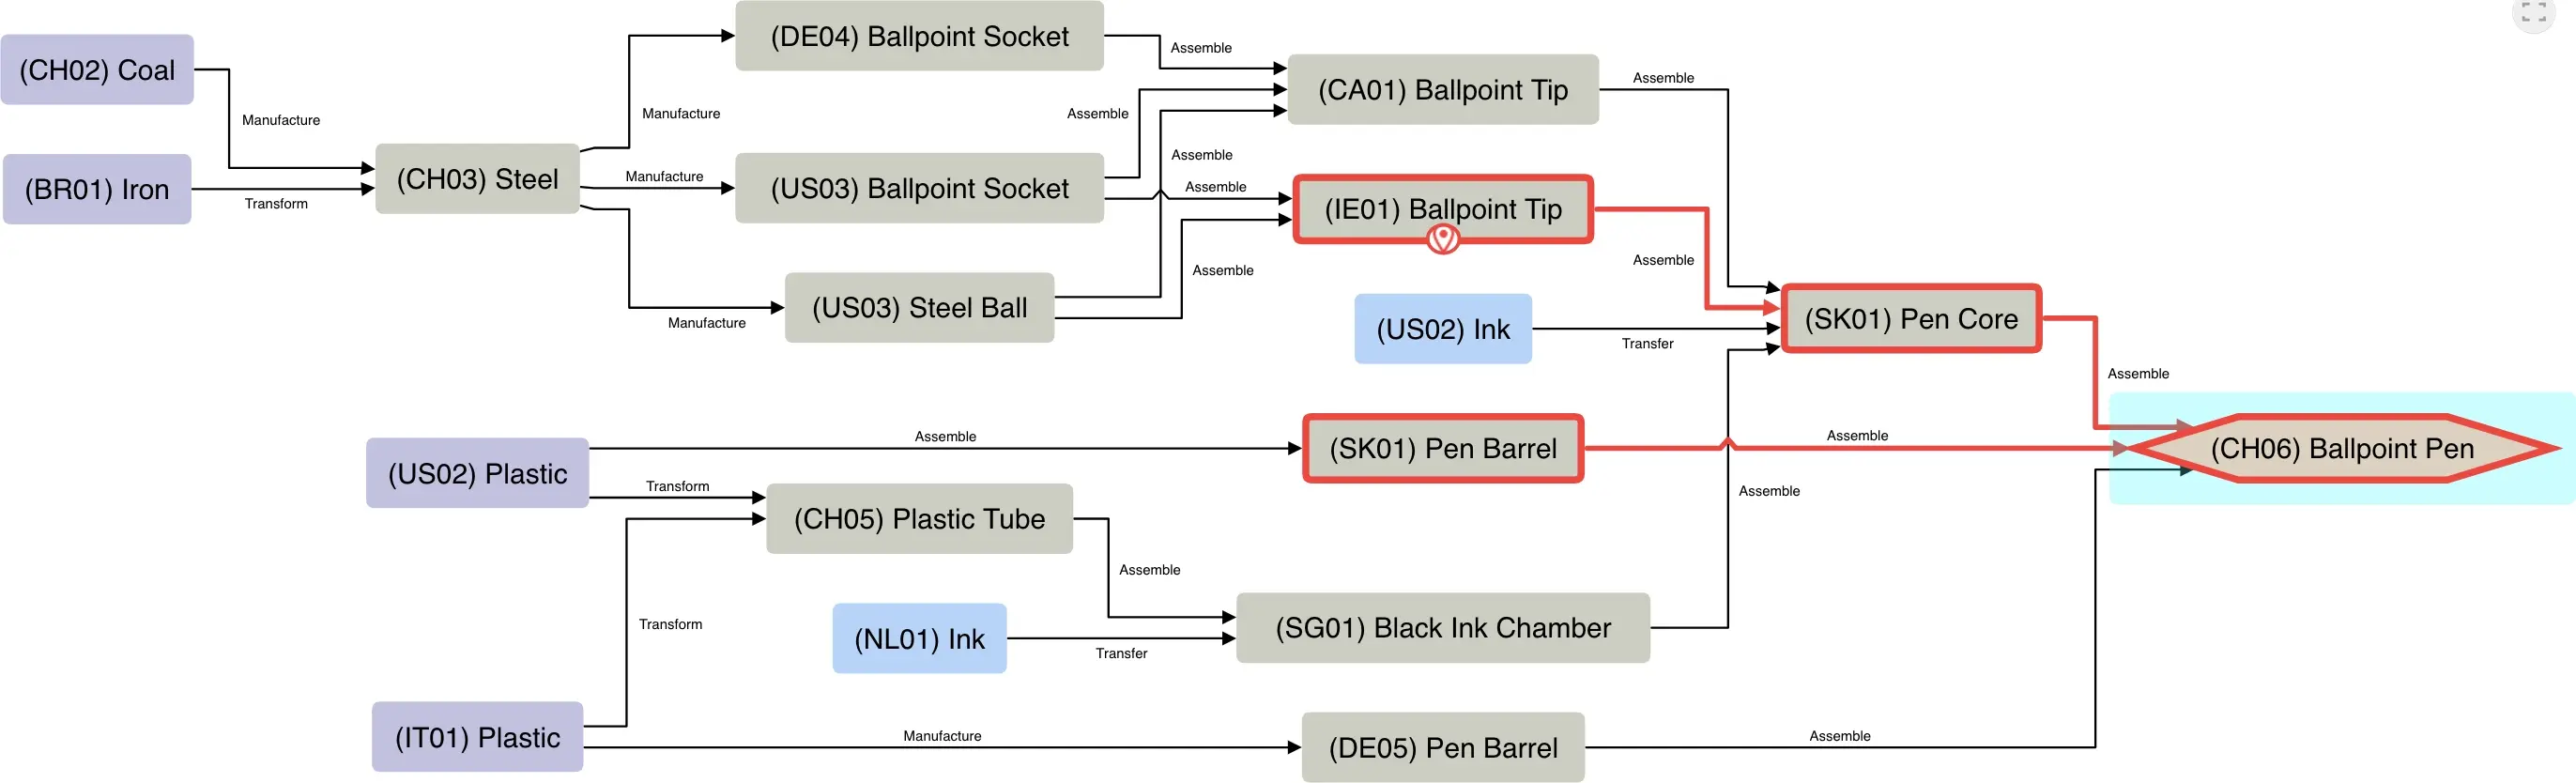
Knowledge graph systems enhance the agility, efficiency, and resilience of supply chain operations by providing a deep, interconnected understanding of all its elements

Supply Chains

Knowledge graph systems enhance the agility, efficiency, and resilience of supply chain operations by providing a deep, interconnected understanding of all its elements. Knowledge graphs hold the keys to these questions: 

  • Where does this asset fit in your supply chain?

  • What impact does the asset have on the overall health of the chain?

  • Can you utilize the asset more effectively?

  • Is this asset the highest or lowest priority for the health of your supply chain? 
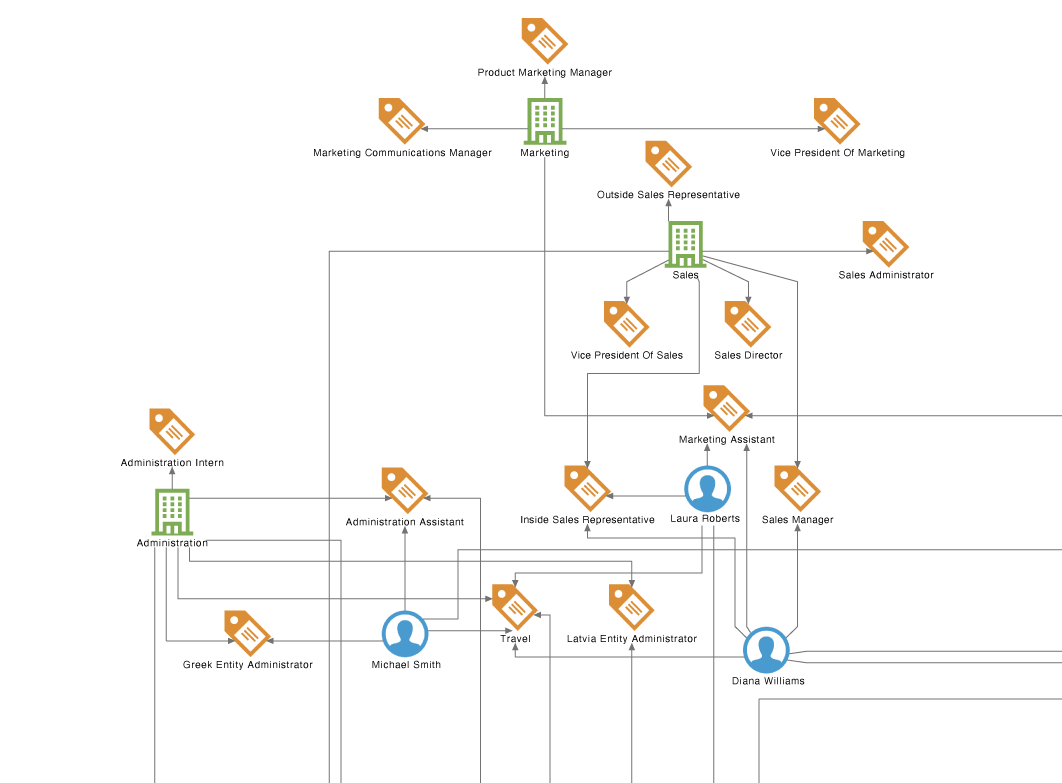
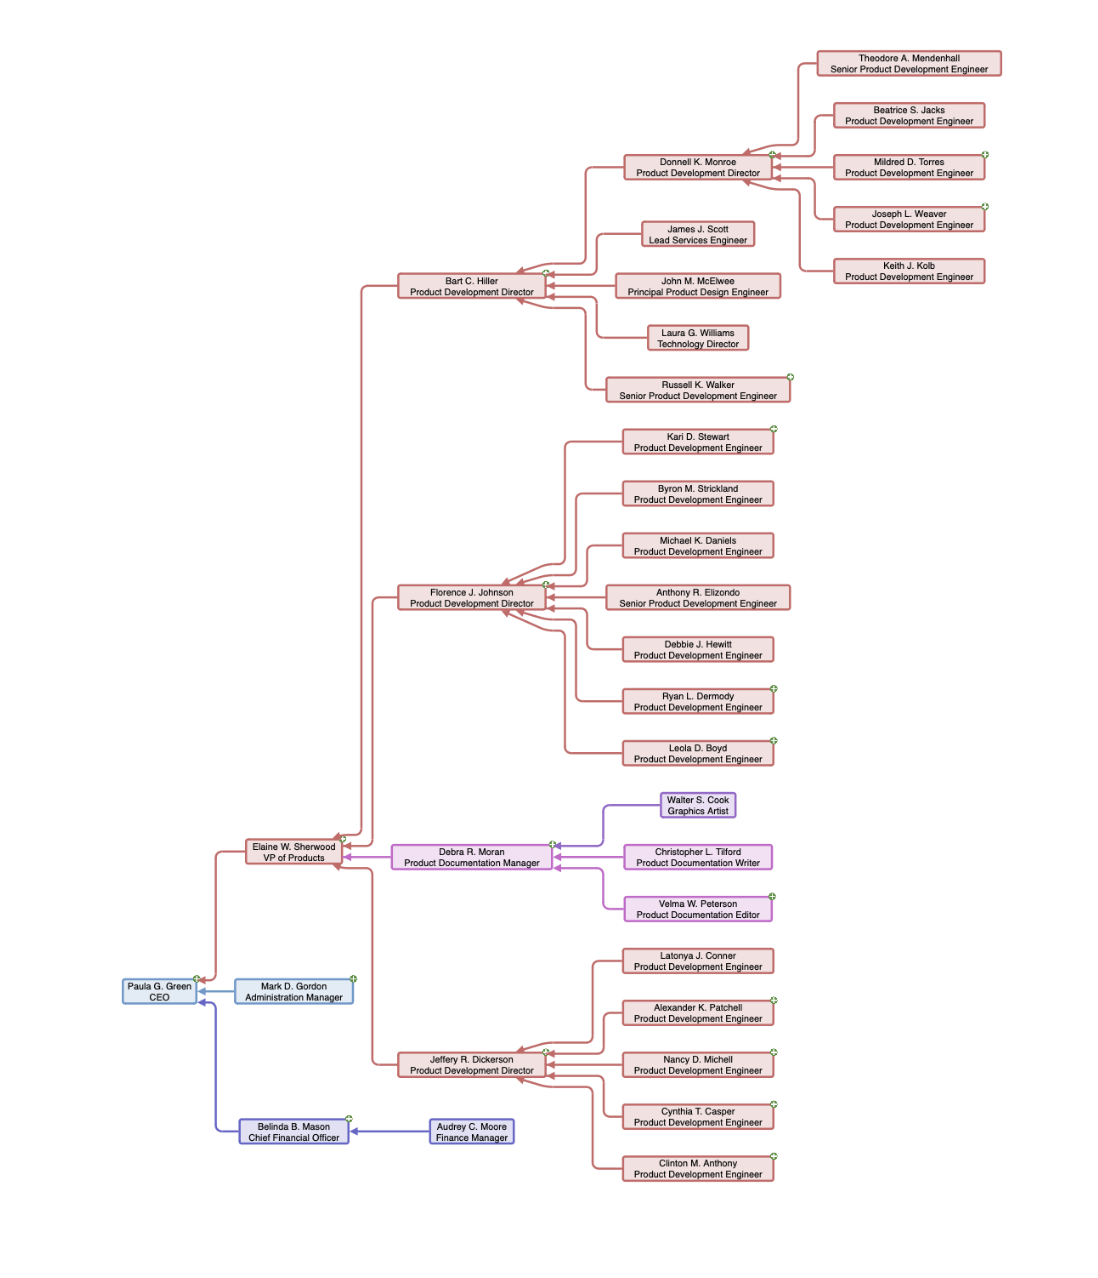
Knowledge graph systems that help you manage your most critical resources—your staff

Human Resources

Do you really know whether you have all the right people doing all the right things? Knowledge graph systems that helps you manage your most critical resources—your staff—can be the best investment you ever make. 

  • Does each team member understand their role and their business goals?

  • Can you spot redundancies in your processes?

  • Do you have the right people in place to make the right decisions?

  • Are your incentives sensible?

Read more in the case study below.
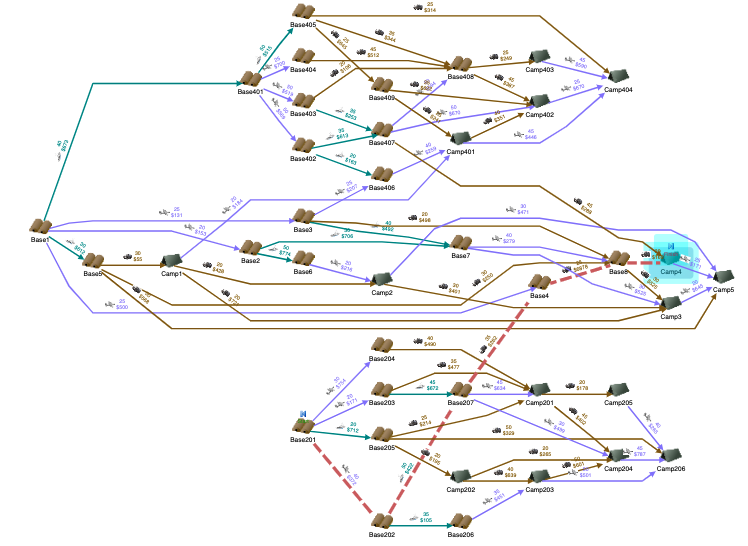
Knowledge graph systems provide a dynamic and interconnected view of the entire supply chain, which is invaluable for navigating the complexities and logistics of modern global supply networks

Logistics

Knowledge graph systems provide a dynamic and interconnected view of the entire supply chain, which is invaluable for navigating the complexities and logistics of modern global supply networks. They can help streamline the complicated dance of moving product from the factory floor to the consumer, understanding bottlenecks, and optimizing the reliability of your network.

  • Is your flow of raw material to the factory secure?

  • Do you have enough room to hold the inventory coming off the production line?

  • Can you move the product from the factory to the distribution center fast enough to meet demand?

  • Where are your most or least reliable shipping partners?

Case study: How OGraph transformed organization management
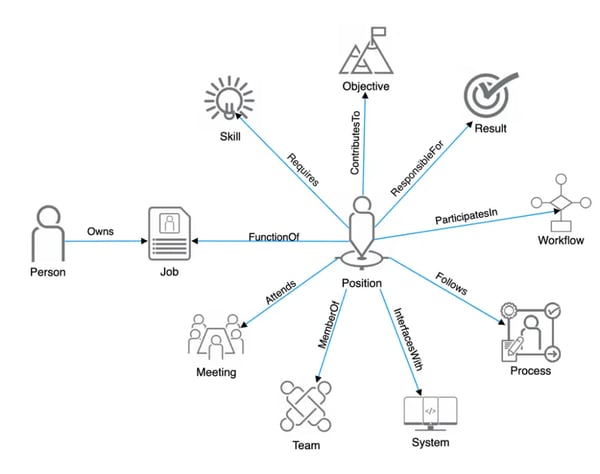
2023.12.20.0.WaltBrownBlog.12Nodes

After helping over 200 companies streamline and clarify their organizations, Walt Brown discovered that all employees should be able to answer 14 basic questions about their job. Questions such as what is the purpose of my job, what skills do I need to advance, and what systems do I interface with and need to master?

After honing his ideas, Walt Brown employed Tom Sawyer Software services to translate his vision of OGraph into a full-fledged SaaS graph application.

Understanding graph technology

Graph databases are specialized databases designed for storing and navigating complex networks of data. The two primary types of graph databases are Property Graph Databases and RDF (Resource Description Framework) Triple Stores. Each type has a unique structure and conceptual framework that is suited for different use cases. 

About RDF knowledge graphs and triple stores

An RDF knowledge graph is a conceptual representation of information, where data is organized as interconnected entities and relationships in the form of RDF triples. Each triple consists of a subject, predicate, and object, representing the network of semantic relationships.

An RDF Triple Store is a specific type of database designed to store and manage RDF triples. It provides the necessary infrastructure to efficiently query and manipulate RDF data, often using SPARQL (SPARQL Protocol and RDF Query Language). 

About labeled property graphs and graph databases

A labeled property graph is a conceptual framework used to represent graph-structured data, focusing on nodes, edges, and their associated labels and properties.

A graph database is designed to store, manage, and query data based on the principles of the labeled property graph model. Property graph databases are proprietary and offer their own knowledge graph querying methods, like Neo4j's Cypher query language.

Key differences between property graphs and semantic knowledge graphs

The key differences between labeled property graphs and semantic knowledge graphs are as follows:


  Labeled Property Graphs Semantic Knowledge Graphs
Structural Approach Focused on the properties of nodes and edges Built around RDF triples and heavily use ontologies for structure and meaning
Flexibility versus Rigidity Offer more flexibility in terms of schema and are often used in more application-specific contexts More rigid due to their formal ontologies, but allow for more powerful semantic queries and data interlinking
Query Language and Standards Use proprietary knowledge graph querying methods Typically use SPARQL aligned with Semantic Web standards


Keep reading to learn more about the differences and why one or the other might best suit your use case.

Labeled property graphs

Structure
In a labeled property graph, data is represented as nodes, edges, and properties. Nodes typically represent entities, edges represent the relationships between these entities, and properties are key-value pairs associated with nodes and edges.

Labels and Properties
Nodes and edges in a labeled property graph are labeled, and these labels typically define the types of entities and relationships. Properties attached to nodes and edges can store additional details about them.

Flexibility in Schema
Labeled property graphs usually do not require a rigid schema, offering flexibility in how data is structured. This makes them suitable for applications where the data model might evolve over time.

Use Cases
Labeled property graphs are widely used in scenarios like social network analysis, recommendation systems, fraud detection, and network analysis, where the focus is on the properties of entities and the strength and characteristics of their relationships.

Query Language
Labeled property graphs typically use proprietary knowledge graph querying methods like Cypher (used in Neo4j), which are designed to efficiently traverse and manipulate graph structures.

Semantic knowledge graphs

Structure
A semantic knowledge graph, often grounded in concepts from the Semantic Web, is built upon RDF (Resource Description Framework) triples. Each triple consists of a subject, predicate, and object, representing entities and their interrelations.

Ontologies and Schema
Semantic knowledge graphs rely heavily on ontologies, which are formal representations of a set of concepts within a domain and the relationships between those concepts. This schema defines the types of entities and relationships in a more rigid and formalized manner.

Semantics and Inferencing
The key feature of semantic knowledge graphs is their emphasis on semantics—the meaning and context of words and relationships. This enables advanced inferencing capabilities, where new knowledge can be derived from existing data.

Standards-Based
Semantic knowledge graphs often adhere to standards like RDF, OWL (Web Ontology Language), and SPARQL (a query language for RDF). These standards promote interoperability and data exchange between different systems.

Use Cases
Semantic knowledge graphs are used in scenarios requiring rich, interconnected descriptions of entities and concepts, like knowledge discovery, semantic search, and data integration in heterogeneous environments.

Linked Data and Knowledge Graphs
Semantic knowledge graphs are a fundamental part of the linked data and knowledge graphs movement, which aims to connect related data across different sources on the web, enhancing the discoverability and usability of the data.

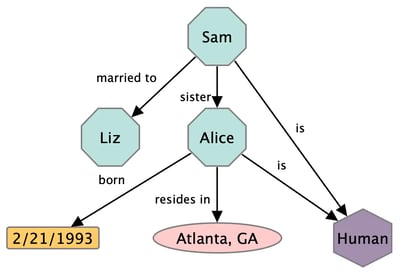
A simplified example

In the following example images, the labeled property graph on the left represents the "Human" type as a node label, and the "birthdate" and "resides-in" properties are represented as a tooltip.

In the semantic knowledge graph on the right, the labels and properties for "type," "birthdate," and "resides-in" are all represented as nodes.
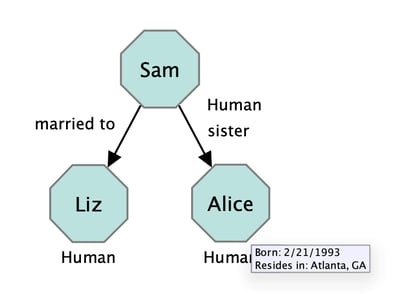
2023.12.19.0.LabeledPropertyGraph.Simple.    A simple knowledge graph showing nodes and edges for every property


How to build and use a knowledge graph

Building a knowledge graph starts with understanding your data and the business questions you need to answer. The following steps help you clarify those goals and define a model of the entities and relationships that matter to your business.

Wherever you are on your knowledge graph journey, Tom Sawyer Software can help you realize your goals for delivering new business value from your enterprise knowledge graph and achieving the value you expect from that investment.

Step 1: Understand your data and the questions you need answered

Start with the business problems you need to solve and the information available to address them. Identify where relevant data is stored, how people use it, and what prevents them from getting the answers they need.

At this stage, you should ask yourself important questions about your data and what you want to achieve.

  • What business questions do you need to answer?

  • What limitations in your existing data or systems stand in the way?

  • How do users need to explore and interact with the information?

  • Do you need to exchange data with third parties or follow an industry standard?

Step 2: Define your knowledge graph model

Define the entities, relationships, and terminology that give your data business meaning. A shared model creates a consistent structure for connecting information across different sources and systems.

Tom Sawyer Software helps you model these relationships so users can work with connected concepts rather than disconnected records.

  • Identify the entities and relationships that matter to your business.

  • Link records that refer to the same thing but use different names or identifiers.

  • Use terminology that is meaningful and consistent for your users.

  • Map data to industry standards or existing ontologies where appropriate.

Step 3: Integrate and federate your data

Connect the enterprise information needed to populate and use your knowledge graph. Depending on your requirements, you can transform and load data into a knowledge graph, federate information across existing systems, or combine both approaches.

Tom Sawyer Software helps connect database data, real-time streams, knowledge graph databases, and other enterprise sources while allowing organizations to continue using the systems they already rely on.

  • Combine information from multiple enterprise data sources.

  • Transform and link data as it moves into a knowledge graph.

  • Incorporate real-time streams alongside existing business data.

  • Federate information across existing systems without requiring all data to be migrated into one database.

Step 4: Visualize, explore, and analyze connected data

Put your connected data to work with interactive visualization, exploration, and analysis. Presenting entities and relationships visually helps users understand context, investigate connections, recognize patterns, and answer complex business questions.

Tom Sawyer Software brings deep expertise in graph visualization and analysis to help users extract value from knowledge graphs and other connected enterprise data.

  • Explore relationships and navigate connected information interactively.

  • Use graph drawings, charts, tables, maps, and other visualizations to provide context.

  • Search for patterns and investigate data without relying solely on predefined reports.

  • Apply graph analysis to uncover important relationships, dependencies, and patterns.

Integrating your data

With Tom Sawyer Software, you can build on the systems you already use. Our solutions support continuous data integration and data federation, giving you flexibility to create a stored knowledge graph, work across existing data sources, or combine these approaches.

Build and maintain a connected knowledge graph

Combine SQL database data and real-time Kafka streams in a structured knowledge graph. Visually design data flows to transform and link information, inspect data structures, and continuously update the graph as source data changes.

This reduces custom integration work and keeps connected information current for downstream visualization and analysis.
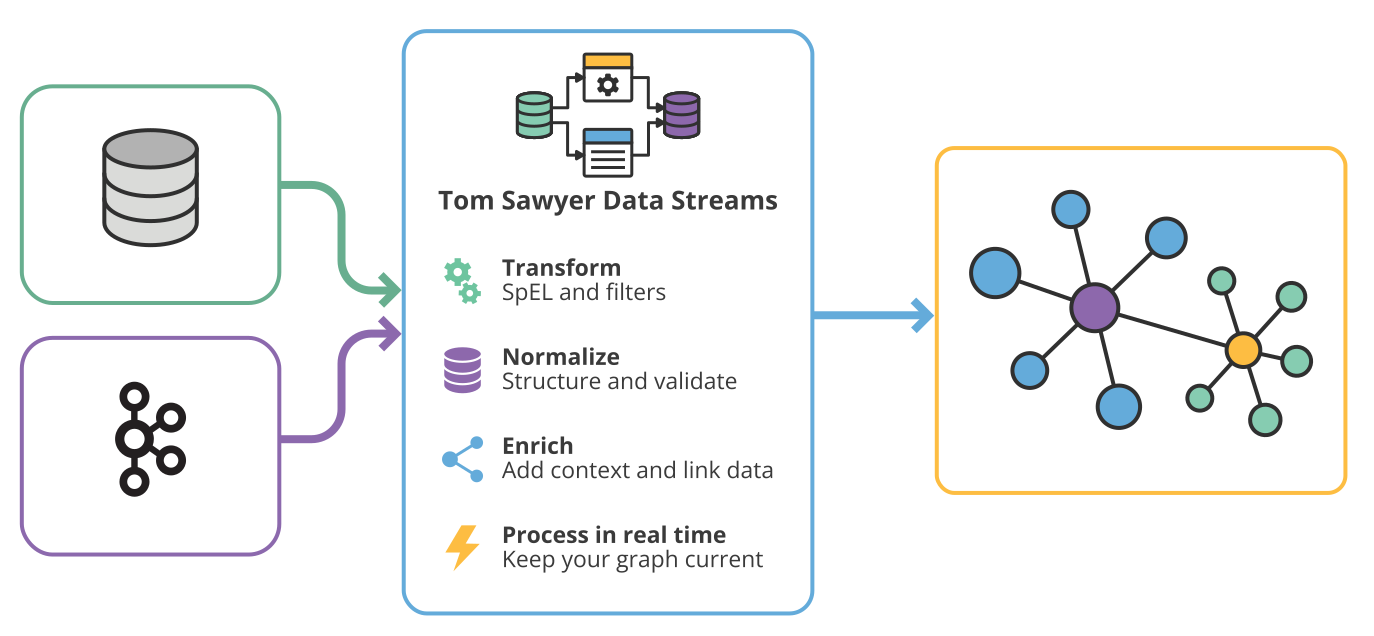
Tom Sawyer Data Streams combines SQL database data and Kafka streams to build and maintain a connected knowledge graph.

Tom Sawyer Data Streams combines SQL database data and Kafka streams to build and maintain a connected knowledge graph.

Federate data from existing systems

Bring together information from existing databases and enterprise systems through a common application schema, without requiring all source data to be migrated into a single database. Model relationships across sources, including an existing knowledge graph, and use an RDF ontology to guide the model where appropriate.

This gives users a connected view of information while allowing your organization to continue using its existing systems and databases.
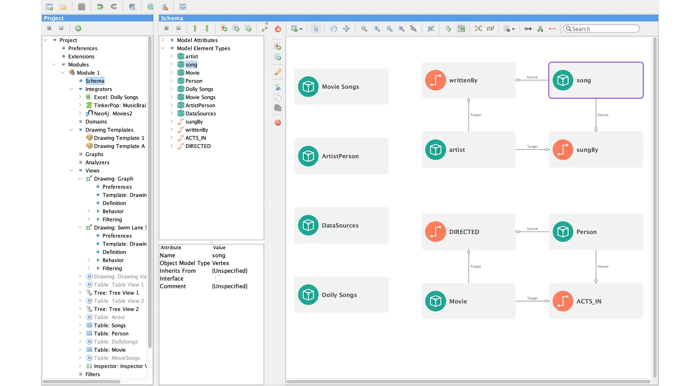
The Tom Sawyer Perspectives schema editor brings data from multiple sources into a common application schema for a connected view of enterprise information.

The Tom Sawyer Perspectives schema editor brings data from multiple sources into a common application schema for a connected view of enterprise information.

Supported data sources and knowledge graph databases

Tom Sawyer Software’s graph technology solutions connect information from knowledge graph databases, relational databases, Kafka streams, and other enterprise sources, helping you work across different data storage and streaming technologies.

Tom Sawyer Data Streams integrates SQL database data and real-time Kafka streams into a structured knowledge graph. Tom Sawyer Perspectives provides integrations for Neo4j, Amazon Neptune, Apache TinkerPop-compatible databases, and RDF data sources using SPARQL, enabling visualization and analysis applications that bring together knowledge graphs and other enterprise data.

Neo4j
Amazon Neptune
openCypher
JanusGraph
Gremlin
Cosmos DB
TinkerPop
RDF
Jena
Oracle

Extract value from your knowledge graph

Connecting your data creates the foundation for deeper understanding. Tom Sawyer Software builds on that foundation with expertise in graph drawing, graph and data visualization, and analysis, helping you develop interactive applications that make complex information easier to explore and interpret. Whether you work with a knowledge graph, federated enterprise data, or both, our graph technology solutions help users uncover relationships, understand dependencies, and answer business-critical questions.

  • Deliver all the context that is required to assess a situation and address it effectively.

  • Reveal hidden connections and enable smooth navigation in every direction.

  • Combine methods of visualization that show a problem from all sides to support effective resolution.

  • Find the edges that give you the leverage to solve business problems.
Graph Drawings

Graph Drawings

Employing graph drawing techniques, such as labels, connectors and nesting, enable you to interact with, navigate and manage complex graph data.
Graph Visualization

Graph Visualization

Applying knowledge graph visualization techniques, such as custom data-driven UIs, can provide context to your data and enable meaningful analysis.
Data Visualization

Data Visualization

Employing dynamic and interactive data visualization techniques using charts, tables, maps and more enhances understanding.
 

Multi-dimensional knowledge graph visualization

Multi-dimensional knowledge graph visualization helps you understand more than which entities are connected. It brings relationships, attributes, and analytical results into a shared visual context.

Shapes, colors, labels, and imagery distinguish different kinds of information, while grouping and nested views organize complex structures. These techniques help users recognize patterns and interpret findings in the context of the wider network.
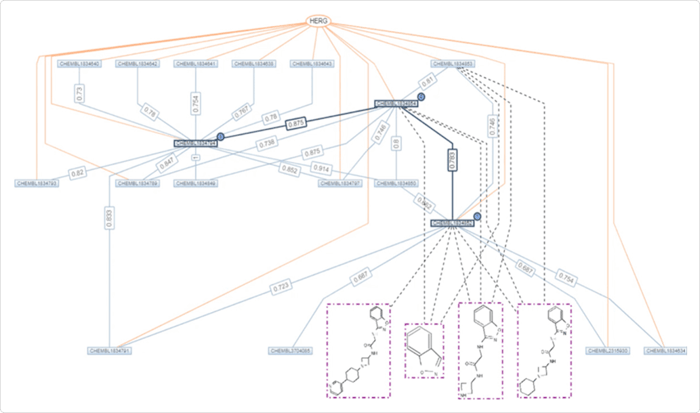
Distinct imagery and visual styling help users distinguish entities and interpret relationships in a chemical similarity analysis.

Distinct imagery and visual styling help users distinguish entities and interpret relationships in a chemical similarity analysis.

Explore knowledge graphs without queries

Queryless exploration allows users to investigate connected data without writing database queries manually. Select the entities and relationships of interest, define search patterns visually, and apply conditions to focus on relevant information. The software generates the underlying queries and presents the results in an interactive visualization.

As questions evolve, expand connections, inspect attributes, and filter the view to follow the investigation. This helps analysts explore beyond predefined reports without needing to learn a query language.

Tom Sawyer Perspectives' Pattern Matching Query Builder enables exploration of knowledge graphs without the need to know SPARQL, Gremlin, or Cypher query languages.

Tom Sawyer Perspectives' Pattern Matching Query Builder enables exploration of knowledge graphs without the need to know SPARQL, Gremlin, or Cypher query languages.

Watch this short video for an example of exploring complex organization structures modeled with the Financial Industry Business Ontology (FIBO).
 

Knowledge graph solutions from Tom Sawyer Software

Whether you are building a new knowledge graph or expanding the value of an existing one, Tom Sawyer Software provides graph technology solutions for connecting, visualizing, and exploring enterprise data. Choose the capabilities that fit your existing systems, application requirements, and the people who need to use your data.

Tom Sawyer Data Streams

Combine database data and Kafka streams to build and maintain a connected knowledge graph.

Tom Sawyer Perspectives

Build custom knowledge graph visualization and analysis applications with a low-code platform.

Tom Sawyer Explorations

Visually query, explore, and analyze knowledge graphs without writing code.
 

Get started today

Contact us to talk about your knowledge graph project and how Tom Sawyer Software can support you.