Gain a Deeper Understanding of Your Data by Utilizing Graph Visualization

Join us September 27, 2023 at 11a.m. PDT for this live webinar

Attain valuable insights and comprehend patterns within your data

Join us for an exciting live webinar where we will showcase Tom Sawyer Perspectives graph visualization, a powerful tool for visually displaying the relationships between data entities.

By visualizing your data in graphs, you can easily identify relationships and trends that may not be apparent through other analytical methods. Graph visualization allows for a professional analysis that can lead to impactful decision-making and improved outcomes.

2023.08.22.0.CrimeDemo.Bundle

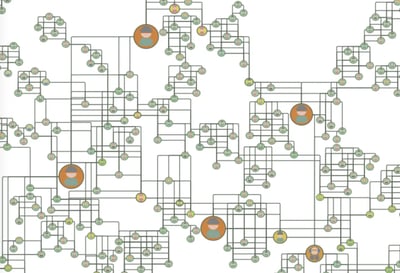
Effective graph visualization increases understanding.

Key benefits

Perspectives graph visualization offers advanced user interfaces that allow you to create precise visualizations of your graph data. You have the ability to define unique graphical styles and interactive behaviors for your graph elements that will be impactful for your end users.

Some of the many benefits include the ability to:

  • Choose from pre-configured node and edge UIs.

  • Use your own images.

  • Customize edge UIs.

  • Apply different node and edge templates to highlight key entities.

  • Customize node and edge colors.

  • Customize font and font size.

What to expect

During this live webinar, we will:

  • Discuss the concept of graph visualization and its relevance in solving big data challenges.

  • Show a live demo of Tom Sawyer Perspectives node UI templates.

  • Show a live demo of Tom Sawyer Perspectives node UI editor.
  • Share practical tips and best practices for effectively utilizing graph visualization for data analysis.


Who should attend

This webinar is designed for:

  • Data engineers and analysts seeking innovative ways to visualize data using graphs.

  • Decision-makers looking for strategies to unlock the full potential of their data through graph visualization.

  • Individuals that are interested in learning about the latest advancements in graph visualization.

Registration closed

We're sorry you missed the webinar. 

But fear not! You can watch a recording of the webinar. And be sure to check our Events page for upcoming webinars.

About the host

Jody Strausser

Jody A. Strausser, D.Sc.
Solutions Engineer
Tom Sawyer Software


Jody Strausser is a Solutions Engineer who is passionate about helping clients leverage software solutions to address their unique data visualization, diagramming, and graph analytics challenges and to deliver tailored solutions that showcase the power and versatility of available technology.

As a professional with both academic and industry experience, he enjoys collaborating with technology enthusiasts to help shape the future of the industry. He dedicated much of his career to serving the Department of Defense in critical software engineering roles. His contributions were instrumental in the development of live, virtual, and constructive simulations, as well as other cutting-edge software solutions that played a pivotal role in the training and development of the U.S. Armed Forces.

In his capacity as a professor of Computer Science and Information Systems over the past decade, Dr. Strausser has made a significant impact by mentoring the next generation of tech industry leaders.

He has degrees in Information Systems and Computer Science from Moravian University, William and Mary University, and Robert Morris University.

Contact us today

We'd love to hear about your data challenges. Contact us for a demonstration of Perspectives today and be amazed.