Graph Application Examples

See the art of the possible with these examples of graph applications built with Perspectives.

Hands-on graph application examples

Experience what your end users will experience from a Perspectives graph application. 

Built using Tom Sawyer Perspectives, our graph application examples showcase the power of graphs applied to domain-specific knowledge management challenges. You'll experience how graph visualization and analysis can be applied to fight fraud, tackle supply chain challenges, manage networks, and more, to enable deep insight and bring new perspective to your data.

See first-hand how graph best-practices, analysis algorithms, and features such as automatic layout, expand and collapse, and data-driven UIs help solve your business challenges.

These real-world graph application examples in different fields include detailed instructions that walk you through the features of the application, and how to navigate the graph application use cases. After launching the example application, click the Documentation icon 2023.11.03.0.Documentation.Icon in the toolbar to see the instructions.

Link analysis graph application scenarios

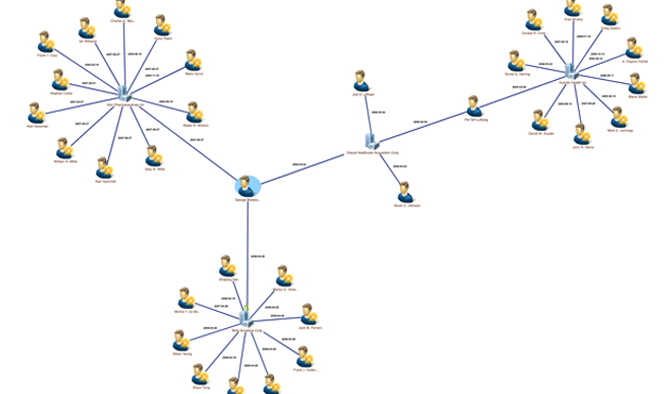
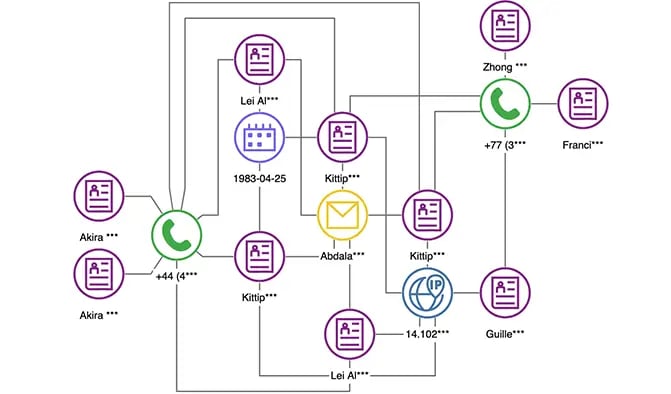
Link Analysis dives deep into the connections between objects, uncovering hidden patterns and insights across various industries. From thwarting fraud to shaping smart cities, it helps in making strategic, data-driven decisions by revealing the unseen links in complex data. Sign up and explore these graph application examples.
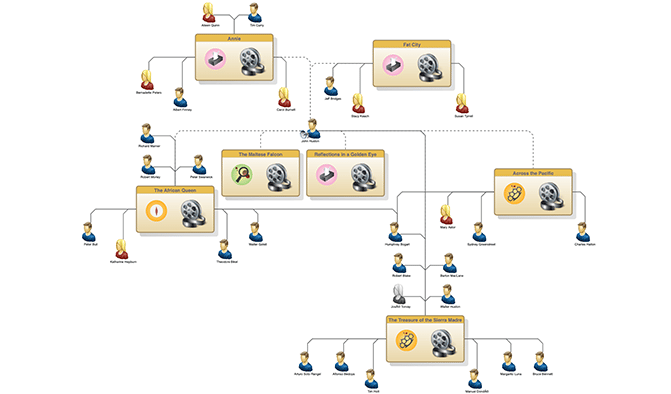
Crime Network graph application example

Crime Network

Identify fraud, find connections, and bust bad guys in this criminal network. This application has social network analysis algorithms you can use to predict patterns and make accurate and strategic decisions.

Social Network Analysis graph application example

Social Network Analysis

Watch how a series of tweets quickly went viral. Track retweets on a map as they are picked up by various news organizations and quickly spread around the globe. View a graph of the accounts and their followers.

Cineasts graph application example

Cineasts

See the "six degrees of separation" in action in this Neo4j movie database that originated from themoviedb.org. Interactively explore the connections between actors, directors, and movies by loading data into the graph drawing.

Governance graph application example

Governance

Explore the Securities and Exchange Commission corporate filing database. See the Directors and Officers at companies and their social network of connections to reveal the most connected individuals.

Public Safety graph application example

Public Safety

Dive into a criminal investigation. Track the activities of criminals and suspects by analyzing the timeline of phone calls, bank transactions and movements using drawing, tree, and inspector views.

Paradise Papers graph application example

Paradise Papers

Analyze relationships in the Paradise Papers in this Neo4j graph database. Control the result limit using incremental loading of data elements and filters to narrow results in the graph.

Fraud detection and analysis graph application examples

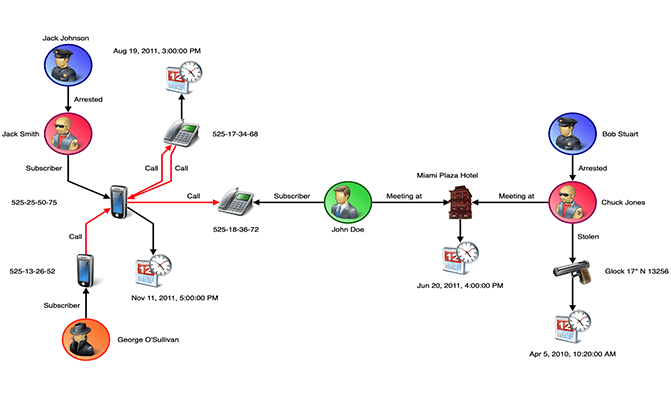
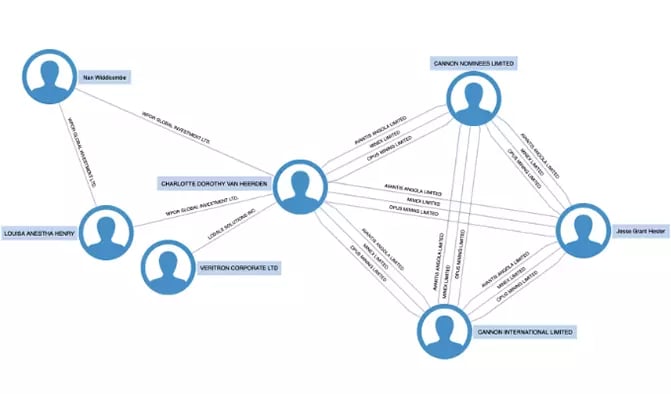
Fraud, affecting millions, is countered by sophisticated detection in finance, government, and more. Advanced graph and data visualizations reveal hidden fraudulent patterns and key players, aiding in predictive analysis and network dismantling. Sign up and explore these graph application examples.

Learn more about fraud detection graph application use cases.

Financial Fraud graph application example

Financial Fraud

Explore financial transactions and the relationships between potentially fraudulent activities to see if you can spot fraud. Apply powerful analytics to view the pathways through which transactions occur.

Crime Network graph application example

Crime Network

Identify fraud, find connections, and bust bad guys in this criminal network. This application has social network analysis algorithms you can use to predict patterns and make accurate and strategic decisions.

Panama Papers graph application example

Panama Papers

Expose people of interest in the famous Panama Papers scandal. Use different data view types to explore the relationships between investors. And run advanced centrality analytics to gain additional insight.

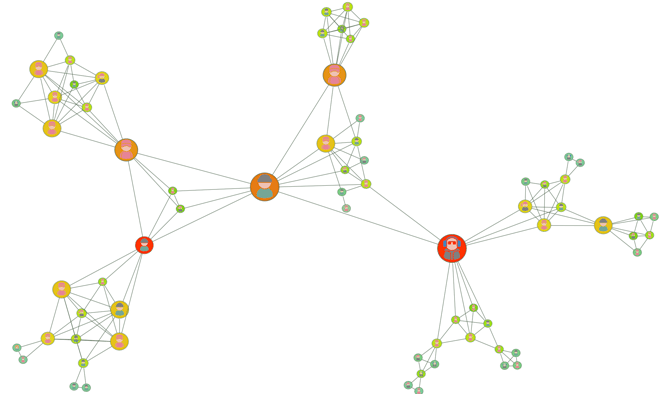
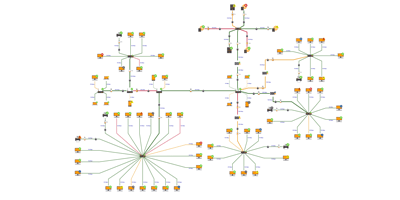
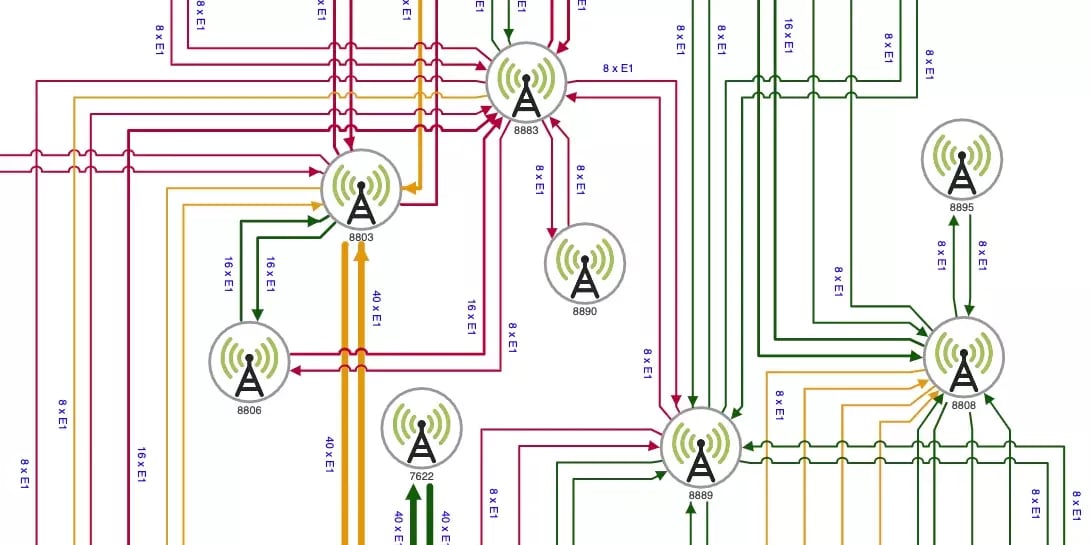
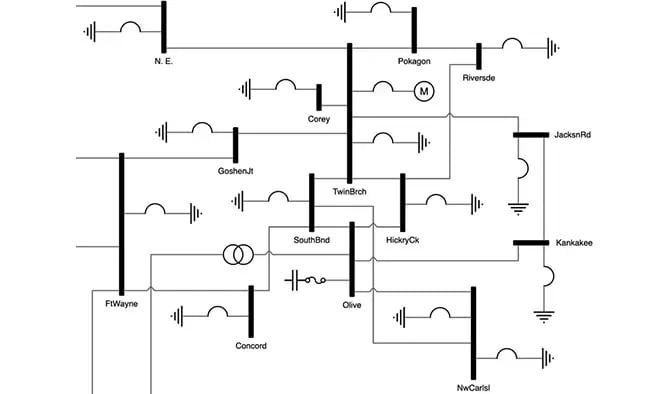
Network topology graph application examples

Network Topology, encompassing both physical and logical layouts, is pivotal for visualizing, managing, and troubleshooting network connections. It allows for effective mapping of devices and data flow, aiding in quick response and optimal solutions for network issues like server downtimes. Sign up and explore these graph application examples.

Network Editor graph application example

Network Editor

Evaluate the health of an IT network. Quickly assess connection load and device status with color-coded node badges, blinking icons, and colored edges. Navigate edges to follow the path of connected devices.

Microwave Network graph application example

Microwave Network

Manage devices and antennas of a microwave transmission network. See first-hand how advanced visualization reveals load and capacity, and how Shortest Path analysis quickly finds the fastest communication routes.

Retail Network graph application example

Retail Network

Track support tickets of shopping malls around the world. Understand the relationships between retail and corporate locations, see open tickets, and expand outlets to see the individual computer network.

IT Network graph application example

IT Network

Analyze relationships in a computer network in this Amazon Neptune graph database. Control the result limit using incremental loading of data elements and filters to narrow results in the graph.

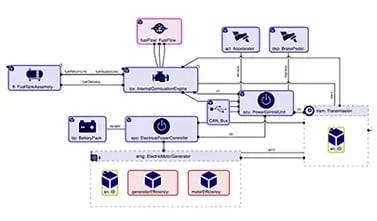
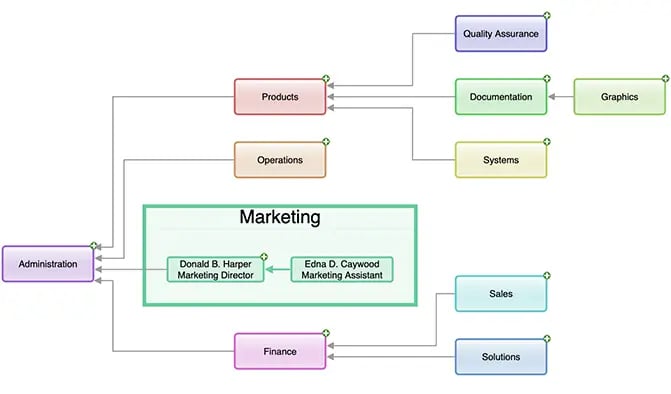
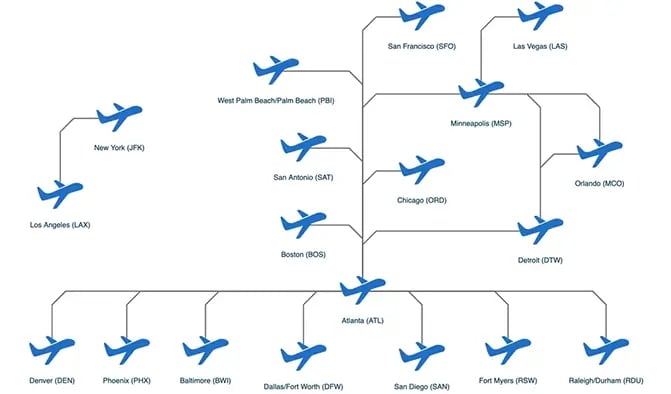
Architectures and models graph application examples

Architectures and models serve as the blueprints of systems, illuminating the intricate web of components and connections within software or system frameworks. They empower users to grasp the complex assembly of their systems, paving the way for strategic modifications and enhancements. With these visual guides, envisioning and implementing changes becomes a clear, informed process, allowing for optimized system evolution. Sign up and explore these graph application examples.

Model-Based Engineering graph application example

Model-Based Engineering

Explore the block definition diagram, internal block diagram, package diagram, and more in this SysML-compliant hybrid SUV model. Interactively load related elements to explore the engineering diagrams.

Organizational Management graph application example

Organizational Management

Explore a company's structure and employee hierarchy through six dynamic views including interactive maps, graphs, and more. See reporting structure, physical locations of staff, and department metrics.

Life Sciences graph application example

Life Sciences

Explore the taxonomic categorization and physical composition of organisms. Navigate concepts and connections to drill in from general taxonomic categories to the functions of cell components.

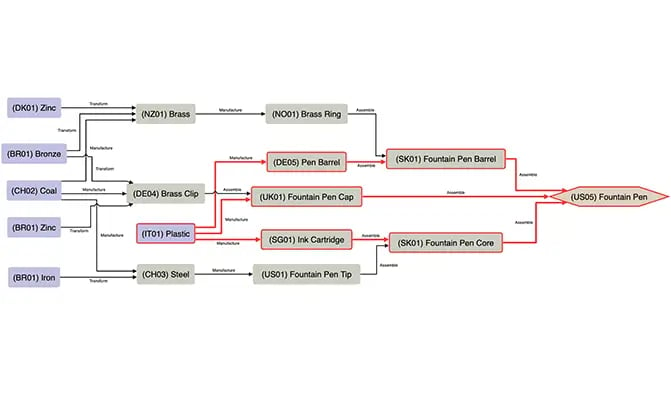
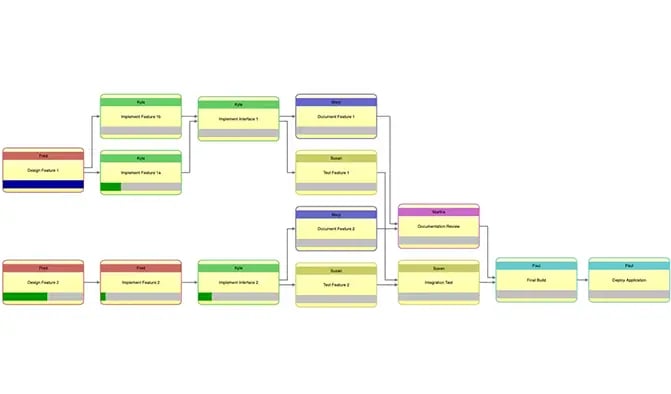
Flows and impacts graph application examples

Complex flows, from insulin production to Mars rover assembly, benefit from clear visual narratives. By mapping each step and transition, visualizations help users identify optimal paths and improve processes, ensuring efficiency and cost-effectiveness. Sign up and explore these graph application examples.

Commodity Flow graph application example

Commodity Flow

Explore the flow of commodities across the United States from a subset of United States Census Bureau data stored in a Neo4j database. See the graph of commodity flow between states, and a geographic map of routes.

Supply Chain graph application example

Supply Chain

Spot and drill into problematic chains in this real-world supply chain example. See the chain of raw materials in several different styles of pens, and the graph of locations from which materials are sourced.

Project Management graph application example

Project Management

See tasks, dependencies, assignments, priorities, and estimates associated with a project. Different views allow assessment of a project and for ongoing modification as the project develops.

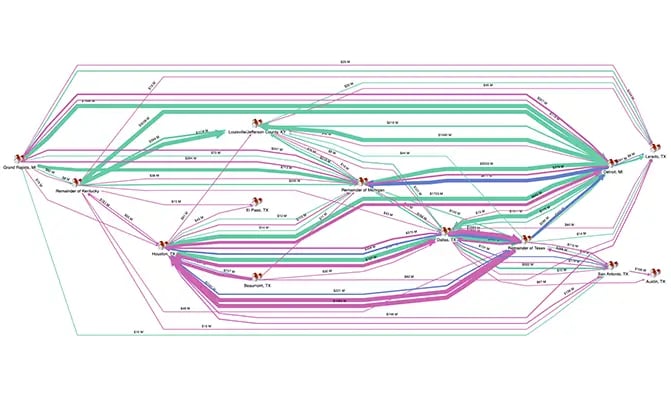
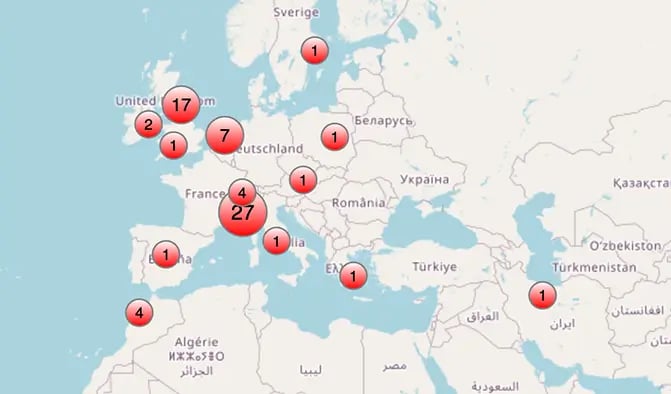
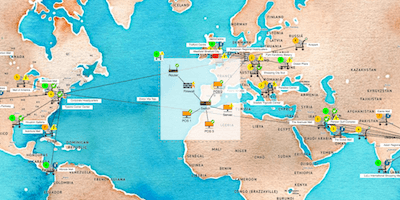
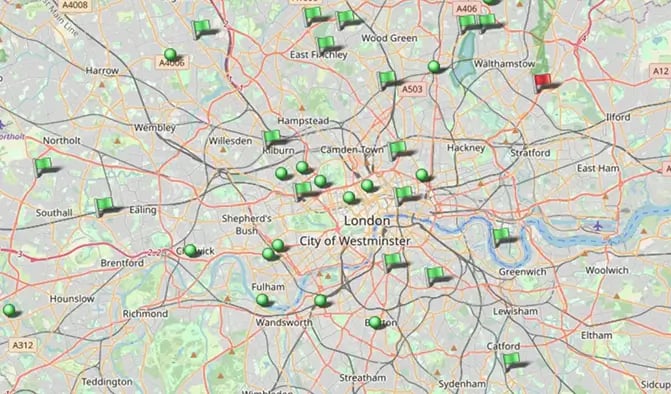
Schematics and maps graph examples

Schematics and maps provide detailed visual guides to complex systems, from computer networks to subway layouts. These tools aid in understanding intricate connections and planning updates, allowing users to effectively visualize and strategize changes within their systems.

Road Safety graph application example

Road Safety

Explore vehicle accident data from the United Kingdom's Department for Transport. See locations of accidents on the map, apply filters, view accidents over time, and explore various charts.

Utilities graph application example

Utilities

Explore power distribution through the visualization of an electric utilities system. Specialized bus-branch layout with load details supports industry standards in combination with interactive views.

Logistics graph application example

Logistics

Visualize logistics terminal locations and connections with both geospatial and logical views. Explore routing details through filters, dialogs, interactive synchronized views, and data-driven edge UIs.

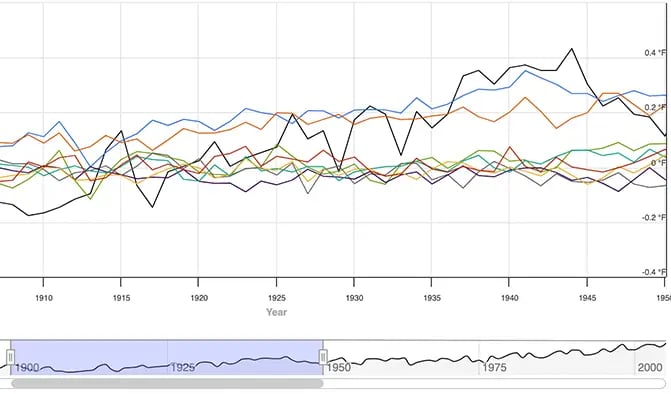
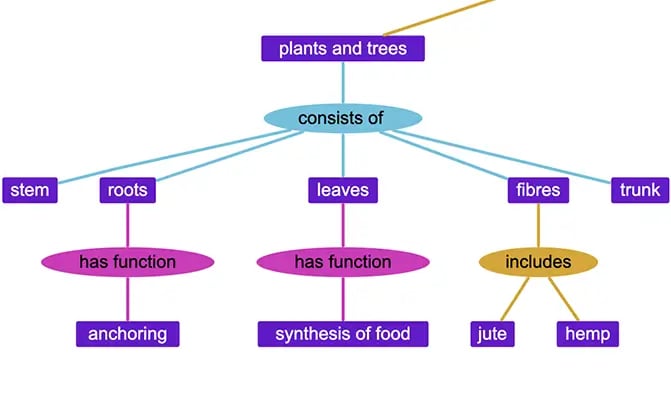
Examples of graph applications with scientific visualizations

Scientific visualization, a specialized field within computer graphics, aims to transform scientific data into graphical formats, enhancing scientists' understanding and analysis. Tom Sawyer Perspectives supports this by providing tools like timelines, maps, charts, and various views, facilitating the exploration of time, event, and network-oriented data, and highlighting crucial relationships within scientific datasets. Sign up and explore these graph application examples.

Climate Change graph application example

Climate Change

Save the planet! Explore data based on findings from NASA's Goddard Institute for Space Studies. See global warming factors, contrasting human and natural forcings through interactive charts and timelines.

Life Sciences graph application example

Life Sciences

Explore the taxonomic categorization and physical composition of organisms. Navigate concepts and connections to drill in from general taxonomic categories to the functions of cell components.

Learn more about graphs and graph technology

Click to learn more about the capabilities you experienced in our graph application examples.

Get an inside look at Perspectives and the powerful graph technology that makes these graph application examples shine.

Graph Analysis

Learn about the power of graph analysis algorithms.

Graph Drawings

Learn how graph drawing techniques can provide deep insight.

Graph Visualization

Learn how graph visualization techniques can solve industry challenges.

Build your own graph application with Perspectives

Watch the video to learn how we built the graph application examples.

With Perspectives, you can quickly integrate with your data sources and have your first graphs and data visualizations in a matter of minutes.


Need help bringing your vision to reality?

We can help bring your vision to reality and wow your stakeholders with a custom proof of concept. With an approved trial, our graph experts can build a custom graph application example for one of your use cases to help start you down the path to success.

More graph application resources

See these other resources to help you build your own application with Perspectives and make the most of our amazing graph technology.
Learn how to build your custom application with Perspectives

How-to videos

See our YouTube channel for how-to videos and demonstrations on building effective graph data applications with Perspectives, and practical applications of graphs to gain insight and achieve results.

Perspectives documentation provides detailed tutorials and step-by-step instructions

Documentation

Explore the Perspectives documentation where you'll find detailed, step-by-step tutorials on everything from standing up your first web application, to integrating with your data source, and everything in between.

The Perspectives free trial includes many application examples

Free trial

Request your free trial of Perspectives. You'll have access to many more graph application examples that you can use as the basis for your custom application or as resources to achieve the effects you require.

Get started today

Contact us to talk about your visualization project, for a live demo of Perspectives, or to start your free trial to use graphs to solve your business challenges.