What is fraud detection?
Fraud detection is the process of identifying and preventing fraudulent activities, such as unauthorized transactions, deceptive practices, or malicious behavior, within various systems or processes. This can apply to a wide range of domains, including finance, e-commerce, healthcare, government, telecommunications, and more.
Fraud and corruption affect the lives of millions of people by impacting the financial health of corporations and individuals. Fraud is typically carried out by multiple parties that, by their very nature, strive to remain hidden in plain sight. As a result, many industries have adopted fraud detection solutions to safeguard businesses, organizations, and individuals from financial losses, reputation damage, and legal liabilities associated with fraudulent activities.
![]()
Fraud detection applies to a wide range of domains, including finance, e-commerce, healthcare, government, telecommunications, and more.
Techniques used to identify fraud
There are various techniques used to identify patterns and anomalies in data that may signify fraudulent activity. These techniques can help organizations stay one step ahead of fraudsters by leveraging the power of data analytics to reveal insights.
Some of the most common techniques used for fraud detection are described below.

Pattern Recognition
This technique involves identifying patterns and anomalies in data that may signify fraudulent activity. For example, if a transaction meets preset fraud criteria, it can be flagged as suspicious.
Neural Networks
This technique involves independently generating classification, clustering, generalization, and forecasting that can then be compared against conclusions raised in internal audits or formal financial documents.

Link Analysis
This technique involves analyzing the relationships between entities to identify fraudulent networks. Fraudulent activity often involves multiple entities, such as a fraudster, a victim, and a middleman, and graph databases can identify behavior patterns indicative of fraud by analyzing the relationships between these entities.

Advantages of using graphs and graph visualization to detect fraud
Graph visualization plays a crucial role in fraud detection by enabling the identification and highlighting of fraud schemes and suspicious patterns in graph and network data.
Represents data in a human-readable form
Graph visualization provides a human-readable representation of data, which is essential for fraud detection, since the sheer amount of data obtained by auditing systems can be challenging to visualize.
Supports analysis of large amounts of data
Graph visualization helps users to quickly analyze large amounts of data and spot patterns that indicate fraudulent activity. It allows investigators to target specific transaction patterns, find anomalies in real-time, and visualize complex relationships between entities.
Categorizes and groups related data
Graph visualization techniques including nesting and grouping aid investigations by categorizing large amounts of data, and enabling analysts to focus on key areas of the data.
Identifies patterns through relationship analysis
Graph visualization helps analyze the relationships between entities to aid in the identification of fraudulent networks. Fraudulent activity often involves multiple entities, such as a fraudster, a victim, and a middleman, and graphs can identify behavior patterns indicative of fraud by analyzing the relationships between these entities.
Identifies hidden connections and relationships
Graph visualization is useful in identifying hidden connections and relationships between data points. Graph visualization can be used to represent the elements of the visualization in a way that is meaningful and enables users to identify different types of entities and relations in order to detect fraud.
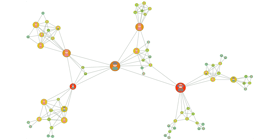
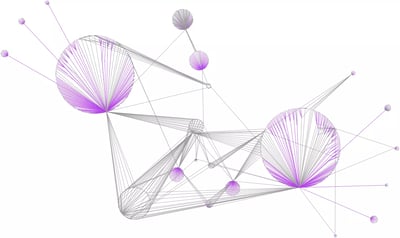
Graph visualizations can help users quickly analyze large amounts of data and spot patterns.
Graph visualization is useful in identifying hidden connections and relationships between data points.
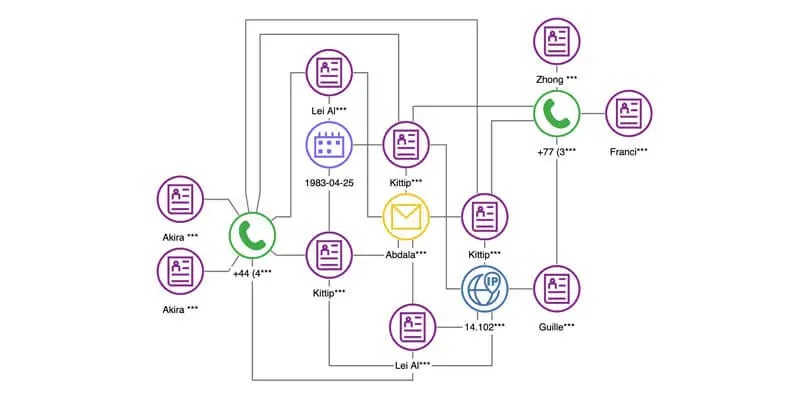
Graph visualization is crucial in fraud detection by enabling the identification and highlighting of fraud schemes in graph and network data. It helps to identify fraudulent networks, hidden connections, and relationships between data points, and provides a human-readable representation of data.
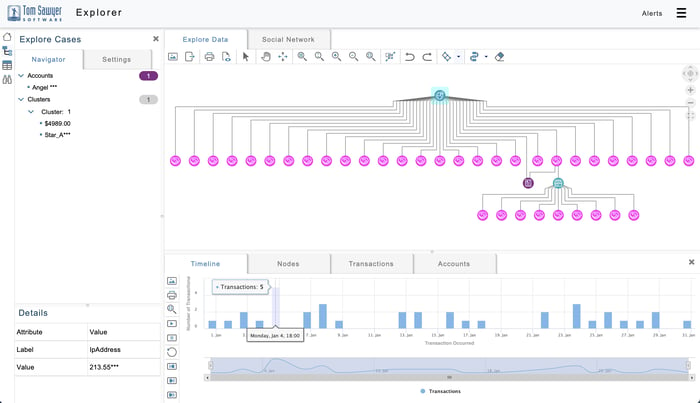
Graph visualization and timeline of suspicious transactions.
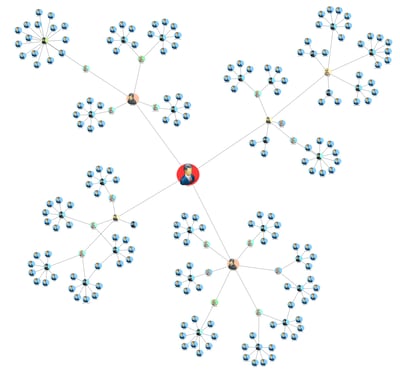
Social network analysis and visualization are a powerful combination that informs predictive analysis and fraud prevention tactics.
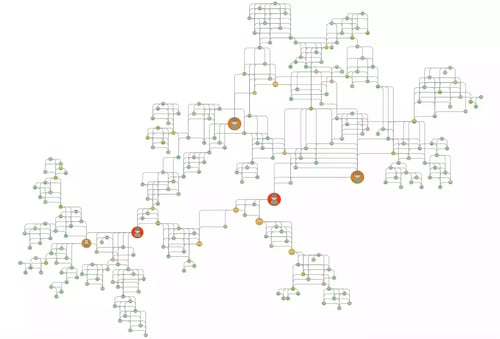
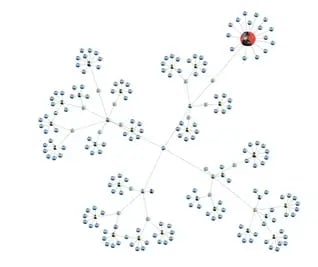
Disrupt fraud rings using social network analysis
Social network analysis is vital to identifying the key, highly connected individuals participating in fraud, tracking down the influencers and ringleaders, and disrupting these networks.
Combined with visualization, your analysts have an arsenal at hand to see the steps that individuals took to commit fraud, see the relationships between fraudulent activities, view the pathways through which transactions occur, and review the patterns in historical fraudulent behavior to inform predictive analysis and fraud prevention tactics.
Fraud detection graph analysis algorithms at your fingertips
Perspectives includes a suite of graph algorithms for data-driven analysis. Some algorithms perform traversals and path analysis, detect or break cycles, and find dependencies and reachable graph elements. Others cluster or partition graph elements, conduct root cause analysis, perform network flow computations, or compute centrality measures in social networks. Below we highlight a few algorithms most useful for identifying potential fraud.
See our full list of supported graph analysis algorithms here.
Betweenness Centrality
Measures a node based on how many shortest paths the node is a member of. It reveals the intermediaries, or middlemen, from the data.
Closeness Centrality
Measures how many steps a message would need to travel to reach all the other nodes in the network.
Bridge Detection
Finds all bridges in an undirected graph. An edge is considered a bridge if it is the only path between its end nodes. When a bridge is removed from an undirected graph, its end nodes are allocated to different connected components of the graph.
PageRank Centrality
Ranks the nodes in a graph by evaluating their importance and relevance based on their connections to other nodes that have a high ranking.
Clustering Algorithm
Groups nodes that share similar properties into sets called clusters. A cluster often represents parts of the graph topology that belong together, and therefore can help fraud analysts focus their efforts.
Shortest Path Detection
Calculates the path that uses the fewest edges between a specified start node and finish node. If the starting node is fraudulent, it can aid the investigation into nearby nodes that may also be fraud or targets of fraud.
Data visualization enhances fraud investigations
In addition to graph drawings, Perspectives supports data visualizations that aid analysis and fraud investigations. Design your fraud application using charts, maps, tables, trees, and inspector views to provide analysts with the tools they need to perform a thorough investigation in their search for fraud.
Data visualization enhances fraud investigations.
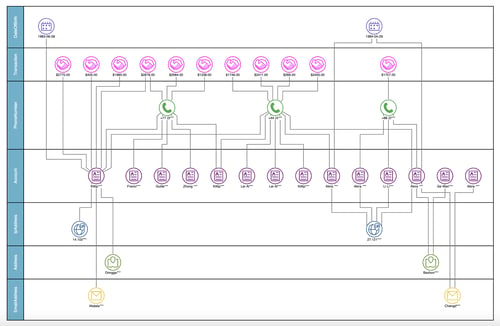
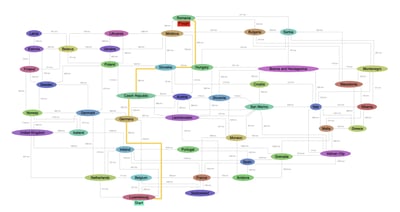
Focus your investigation with an easy-to-use query builder
With Perspectives advanced, visual query builder, users can search for matching patterns in graphs and load data from graph databases without the need to know SPARQL, Gremlin, or Cypher query languages. Use advanced pattern matching to create visual patterns and search for connectivity patterns in data to aid investigations.

Easily explore data and focus your investigations with Perspectives visual query builder.
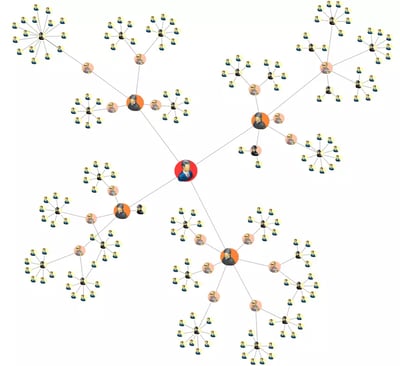
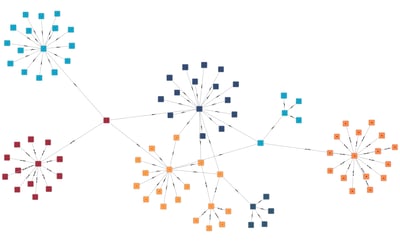
Customize a fraud detection dashboard with Perspectives
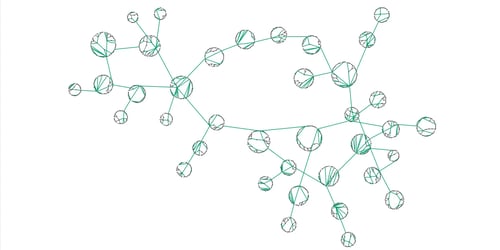
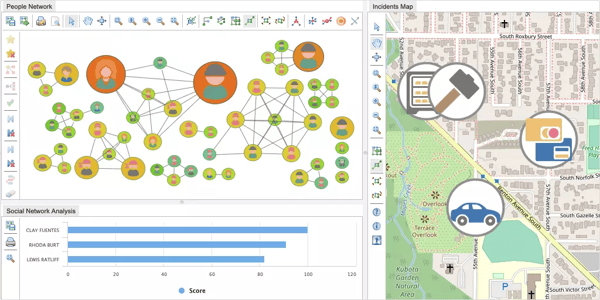
With Perspectives, you can design a custom dashboard for your fraud application that includes graph drawings, charts, tables, trees, and powerful analysis algorithms to enable investigators in their search for fraud.
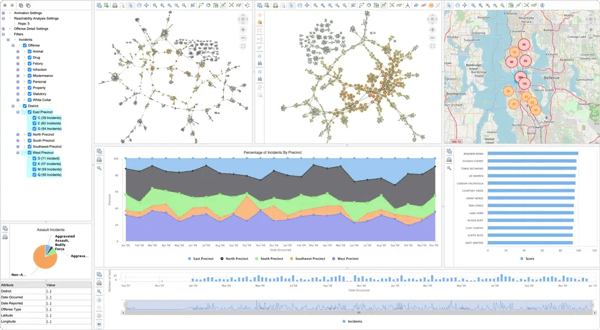
Example crime network application built with Perspectives.